

仅供专业投资者、合格投资者或相关人士(CKA)参阅
CIO摘要
- 劳动力市场保持韧性,12月加息仍具可能。最新就业数据表现超预期坚挺,支撑美联储鹰派基调。我们的基准假设是美联储12月加息的概率高于9月。
- 美联储vs财政部:各行其道的两“醉汉”。财政部长贝森特与美联储主席沃什当下政策路径明显分化,推高长端利率不确定性,也进一步巩固我们增配短端资产的偏好。
- 但二者仍拴在一根绳上。贝森特与沃什深知各自政策会互相扰动,因此必须审慎把握政策力度,妥善应对政策交叉冲击。这根“绳”决定了任何一方都不能过度激进,否则会损害双方共同目标。当投资者完全忽视这种制衡关系时,市场或将迎来买入窗口,但目前时机尚未到来。
- AI主题股债二选一,不宜同时超配。Alphabet首次发行澳元袋鼠债,凸显美国云巨头在非美元市场分散融资的能力。这可能演变为新兴趋势,进一步放大AI集中度风险。
- 宏观环境充满不确定性,叠加AI集中度风险不断上升,我们维持对短久期、高评级、投资级债券的核心推荐。
- 本月焦点债券:BABA 4.875% 2030年5月26日到期
债券雷达
以下是我们产品团队定期更新的热门投资级(IG)债券清单,仅供参考。需特别说明的是,此类债券仅作信息参考之用,并不构成我们的正式投资建议。如需了解更多详情,请联系我们的固定收益及信贷专员陈顺超 (benjamintan@uobkh.com)。
亚洲非金融企业
Company | Bond Name | ISIN | Current Price (Sep 3) | YTM (%) | Duration (y) | 6M Performance (%) |
Abu Dhabi | TAQAUH 4.375% | XS2600246552 | USD 98.73 | 4.94 | 2.22 | -1.61 |
Abu Dhabi’s government-owned energy and water conglomerate with the world’s largest single-site solar power plant and other renewables. | ||||||
Singtel | STSP 2.375% | XS2046591413 | USD 93.68 | 4.68 | 2.82 | -1.21 |
State-owned telecom. Largest in Singapore, second in Australia (Optus) and India (Bharti Airtel). Invests in 5G, cloud, and cybersecurity. | ||||||
Petronas | PETMK 3.50% 21 Apr 2030 | USY68856AT38 | USD 95.25 | 4.95 | 3.31 | -2.33 |
Malaysia’s fully government-owned national oil company, operating across the entire oil and gas value chain with strong state support, robust cash generation, and a globally diversified asset base. | ||||||
TSMC | TAISEM 4.125% | US872898AG66 | USD 98.69 | 4.66 | 2.43 | -1.59 |
Top semiconductor manufacturer with leading technologies like the first commercial extreme-ultraviolet lithography (EUV). | ||||||
Alibaba | BABA 4.875% | USG01719AK24 | USD 100.01 | 4.87 | 3.33 | -2.94 |
China’s largest e-commerce company with around 50% market share and a growing user base. Leading cloud provider in Asia Pacific. | ||||||
CNPC Global | CNPCCH 2% | XS2179918037 | USD 90.8 | 4.67 | 3.56 | -1.95 |
| China's government-owned largest oil and gas producer and supplier. One of the world's major oilfield service providers and a globally reputed contractor in engineering construction. | |||||
CNOOC FINANCE | CNOOC 2.875% | US12625GAF19 | USD 94.72 | 4.74 | 2.85 | -1.69 |
| China's state-owned and largest producer of offshore crude oil and natural gas. Known for its pioneering deepwater drilling capabilities. | |||||
Meituan
| MEITUA 4.625% 2 Oct 2029 | USG59669AF11 | USD 98.3 | 5.23 | 2.77 | -2.31 |
| Leading Chinese e-commerce platform for local services, offering a wide range of services such as food delivery, travel booking, and entertainment through its app. | |||||
JD.com
| JD 3.375% 14 Jan 2030 | US47215PAE60 | USD 95.75 | 4.76 | 3.11 | -1.93 |
One of China’s largest e-commerce platforms, focusing on high-quality, branded products, and in-house logistics, making it the leader in categories like electronics and home appliances. | ||||||
Xiaomi
| XIAOMI 3.375% 29 Apr 2030 | USY77108AA93 | USD 94.58 | 5.02 | 3.34 | -1.96 |
| Leading Chinese technology company that designs smartphones, smart devices, and IoT products, recently expanding into electric vehicles | |||||
SK Hynix
| HYUELE 4.375% 9 Nov 2030 | USY8085FBZ28 | USD 97.32 | 5.12 | 3.55 | -3.29 |
| SK Hynix is the world’s second-largest memory chipmaker and a key beneficiary of the global AI-driven demand for high-bandwidth memory. | |||||
Singapore Airlines
| SIASP 3.5% | SGXF10397887 | SGD 104.39 | 2.40 | 3.90 | -1.17 |
| Temasek-controlled, Singapore’s flag carrier with a young fleet and robust liquidity, benefitting from quasi-sovereign support. Operating a full-service carrier (SIA) and low-cost carrier (Scoot) across 130-plus destinations. | |||||
MPACT Treasury
| MCTSP 4.25% 29 Mar 2030 | SGXF59943971 | SGD 106.31 | 2.39 | 3.25 | -1.58 |
| Temasek-backed REIT, owning flagship VivoCity and diversified Grade-A assets across Singapore, Hong Kong and North Asia, providing resilient distributions with organic growth upside. | |||||
Starhub
| STHSP 2.48% 08 Jan 2031 | SGXF30667780 | SGD 99.96 | 2.49 | 4.07 | -0.76 |
| Integrated Singapore telco spanning mobile, broadband, pay-TV and enterprise-ICT services, leveraging 5G and digital platforms to stabilise cash flows and reignite growth. Majority-owned by ST Telemedia, a wholly owned Temasek portfolio company. | |||||
资料来源:彭博。所有价格与收益率仅为指示性报价,仅供参考。如需进一步信息,请联系大华继显产品团队。
欧美非金融企业
Company | Bond Name | ISIN | Current Price (Sep 3) | YTM (%) | Duration (y) | 6M Performance (%) |
Microsoft | MSFT 1.35% | USU59340AK20 | USD 88.17 | 4.60 | 3.81 | -2.28 |
Big Tech leader with businesses in operating system, search engine, cloud computing, and artificial intelligence etc. A combination of stable cash flows and new growth opportunities. | ||||||
Meta | META 4.8% | US30303M8M79 | USD 99.61 | 4.92 | 3.30 | -3.37 |
Previously Facebook, the origin of today's social media trend. With a growing user base of nearly 4 billion (half of the world population). | ||||||
Nvidia
| NVDA 2.85% 01 Apr 2030 | US67066GAF19 | USD 93.39 | 4.89 | 3.29 | -2.72 |
A prominent chipmaker that designs graphics processing units (GPUs) for gaming and artificial intelligence. It held a dominant position in the graphics cards industry with an 80.2% market share in 2Q23. | ||||||
Costco | COST 1.6% | US22160KAP03 | USD 89.7 | 4.72 | 3.43 | -1.78 |
World's 3rd largest retailer which operates a chain of membership-only big-box warehouse club retail stores. | ||||||
Procter & Gamble | PG 4.35% | US742718GF07 | USD 99.79 | 4.44 | 2.25 | -2.30 |
Founded more than 180 years ago with operations in over 70 countries. Specialize in a wide range of personal health/consumer health, personal care, and hygiene products. | ||||||
Nestle | NESNVX 4.65% | USU6408XAK55 | USD 99.95 | 4.67 | 2.30 | -2.33 |
World's largest food and beverage company with over 2,000 brands and a presence in 188 countries. | ||||||
Pepsico | PEP 4.1% | US713448GL64 | USD 98.96 | 4.57 | 2.21 | -1.87 |
Second-largest food and beverage business in the world based on net revenue, profit, and market capitalization. | ||||||
Coca-Cola Co | KO 2.125% | US191216CM09 | USD 93.1 | 4.61 | 2.83 | -1.66 |
Distributes the world's best-selling soft drink in over 200 countries, outselling its nearest competitor Pepsi by a significant margin. | ||||||
Pfizer | PFE 3.45% | US717081ET61 | USD 97.22 | 4.63 | 2.35 | -1.85 |
Founded in the mid-19th century, American drug maker with a strong and diversified drug portfolio. Biggest pharmaceutical company in the world based on the 2022 revenue. | ||||||
BP Capital America | BPLN 3.723% | US05565QDH83 | USD 97.98 | 4.69 | 2.09 | -1.63 |
Key player in the oil and gas industry that operates in 70 countries. It produces 2.3 million barrels of oil equivalent per day in 2022. | ||||||
McDonald's Corp | MCD 4.8% | US58013MFU36 | USD 100.24 | 4.66 | 1.76 | -1.80 |
The biggest fast-food chain in the world operating in the US and internationally with over 40,000 restaurants worldwide. | ||||||
Walt Disney | DIS 7.625% | USU25497AU95 | USD 106.68 | 4.45 | 2.02 | -2.68 |
Founded in 1923, a leading entertainment and production company known for its iconic animated film theme parks, streaming services, and media networks, creating magical experiences for audiences worldwide. | ||||||
JOHNSON & JOHNSON | JNJ 4.9% | US478160CV47 | USD 100.88 | 4.68 | 4.01 | -3.41 |
Johnson & Johnson manufactures health care products and provides related services for the consumer, pharmaceutical, and medical devices and diagnostics markets. The Company sells products such as skin and hair care products, acetaminophen products, pharmaceuticals, diagnostic equipment, and surgical equipment in countries located around the world. | ||||||
资料来源:彭博。所有价格与收益率仅为指示性报价,仅供参考。如需进一步信息,请联系大华继显产品团队。
全球金融机构
Company | Bond Name | ISIN | Current Price (Sep 3) | YTM (%) | Duration (y) | 6M Performance (%) |
JP Morgan | JPM 4.005% | US46647PAR73 | USD 100.68 | 4.75 | 2.73 | -1.92 |
a) Largest bank in the world by market cap b) CET1 (Common equity Tier 1) ratio at 14.3% in 1Q26. Down 0.2% from 4Q25. Attention: c) Senior Unsecured bond, with respect to the exercise of US bail-in power. d) Resettable features. | ||||||
Bank of America
| BAC 2.087% | US06051GJZ37 | USD 98.14 | 4.75 | 2.39 | -1.36 |
a) The 2nd largest bank, globally, majoring in commercial banking, wealth management and investment banking b) CET1 ratio at 11.2% in 1Q26. Down 0.2% from 4Q25. Attention: c) Senior Unsecured bond, with respect to the exercise of US bail-in power. d) Resettable features. | ||||||
UBS AG | UBS 5.428% | USH42097EV54 | USD 100.87 | 5.04 | 2.24 | -2.33 |
a) One of the most well-established and influential banks globally. Foremost bank in Switzerland, focusing on wealth management, asset management and investment banking. b) CET1 ratio at 14.7% in 1Q26. Up 0.3% from 4Q25. Attention: c) Senior Unsecured bond, with respect to the exercise of Swiss bail-in power. d) Resettable features. | ||||||
HSBC Holdings | HSBC 4.583% | US404280BT50 | USD 101.33 | 4.85 | 3.04 | -1.88 |
a) Bank giant with unique historical and business links to East Asia and a highly multinational footprint b) CET1 ratio at 14.0% in 1Q26. Down 0.9% from 4Q25. Attention: c) Senior Unsecured bond, with respect to the exercise of UK bail-in power. d) Resettable features. | ||||||
BNP Paribas | BNP 5.27% | FR001400JF24 | USD 101.23 | 4.88 | 3.04 | -1.61 |
a) Flagship bank in France, 2nd largest bank in Europe by asset. b) CET1 ratio at 12.8% in 1Q26. Up 0.2% from 4Q25. Attention: c) Senior Preferred bond, with respect to the exercise of France bail-in power. d) Resettable features. | ||||||
Standard Chartered
| STANLN 4.299% 13 Jan 2030 | XS3258535908 | USD 98.23 | 5.10 | 2.19 | -1.76 |
a) Prominent international banking group with a strong presence across Asia, Africa, and the Middle East. b) CET1 ratio at 13.4% in 1Q26. Down 0.7% from 4Q25. Attention: c) Senior Unsecured bond, with respect to the exercise of UK bail-in power. d) Resettable features | ||||||
National Australia Bank | NAB 4.308% 13 Jun 2028 | US632525CJ86 | AUD 98.42 | 5.07 | 3.31 | -0.37 |
a) Australia’s largest business bank (“Big Four”) b) CET1 ratio at 11.48% in 1Q26. Down 0.22% from 4Q25. Attention: c) Senior Unsecured bond | ||||||
FWD Group Holdings
| FWDGHD 7.784% 6 Dec 2033 | XS2730013104 | USD 111.4 | 5.83 | 5.51 | -4.58 |
Hong Kong–headquartered life insurer operating across 10 Asian markets, including Hong Kong, Singapore, Japan, Thailand, Indonesia, and the Philippines, serving over 34 million customers with diversified life, health, and general insurance products. | ||||||
Westpac Banking Corporation
| WSTP 5.151% 12 Feb 2031 | AU3CB0331148 | AUD 100.21 | 5.09 | 3.96 | n.a. |
a) Headquartered in Sydney and Australia’s oldest bank (“Big Four”) b) CET 1 ratio at 12.42% in 1H26. Up 0.18% yoy. Attention: c) Senior Unsecured bond | ||||||
资料来源:彭博。所有价格与收益率仅为指示性报价,仅供参考。如需进一步信息,请联系大华继显产品团队。
我们还就上述债券雷达的部分债券提供定期更新。本月焦点债券为:
BABA 4.875% 2030年5月26日到期
发行主体简介
阿里巴巴集团控股有限公司(BABA/9988.HK)为中国规模最大电商平台、头部云服务商及全球全栈AI龙头,业务涵盖线上零售、云计算、AI自研技术、物流及金融服务。截至2026年9月3日,公司股权市值2,730亿美元,现金储备570亿美元。公司存量未偿债券268.8亿美元,平均期限10年,平均固定票息2.92%(彭博数据)。
投资逻辑
- 全栈AI龙头优势。阿里巴巴搭建起涵盖云服务、AI大模型、应用套件与自研定制芯片的完整AI生态。为巩固技术领先地位,公司计划未来三年投入人民币3,800亿元(560亿美元)资本开支,该规模位居中国前列,超过其过去十年资本开支总和,进一步夯实全栈竞争壁垒。请点击此处查看关于阿里巴巴全栈优势的详细分析。
- 高额资本开支构成主要信用担忧。和其他超大规模云厂商类似,大规模资本开支对阿里巴巴而言是一把双刃剑。2027财年一季度,公司资本开支同比激增75%至人民币677亿元,导致自由现金流为负人民币447亿元,上年同期自由现金流则为负人民币188亿元。
- 大额资本开支打开可观变现空间。乐观一面是,阿里巴巴人民币3,800亿元的三年AI资本开支计划已完成约一半投放。管理层测算当前AI算力投资回收期为三年;若产能利用率、自研芯片渗透率以及云业务利润率持续改善,则投资回收期有望进一步缩短。
- 核心风险集中于AI投资回报率(ROI)。主要风险场景为AI高资本开支持续时间超出预期,而变现效果不足,导致盈利持续承压、自由现金流维持负值。考虑到AI投入增加,大华继显近期将公司2027财年盈利预测下调6.6%。尽管如此,阿里巴巴目前财务基本面仍处于可控稳健区间(详见下文)。
财务亮点(2027财年第一季度)
- 经营现金流/利息费用:9.75倍。尽管资本开支处于高位,但强劲的利息保障倍数意味着公司偿债能力充裕。
- 自由现金流/总债务: 17.33%。自由现金流为负,反映阿里巴巴在AI及云基础设施方面投入巨额资本开支,对现金流形成明显消耗。自由现金流是需要持续跟踪的一项核心信用指标。
- 净债务/EBITDA:5.72倍。该指标显示杠杆水平偏高,主要反映当前处于投资周期扩张阶段。盈利持续增长以及资本开支变现是推动降杠杆的关键因素。
- 流动比率:1.36倍。流动资产明显高于短期负债,表明短期流动性扎实,营运资本缓冲充足。
- 投入资本回报率(ROIC):1.44%。当前低回报主要源于AI大规模前期投入;随着AI业务持续规模化扩张并贡献更高利润率,ROIC有望逐步改善。
宏观评论
我们持续跟踪以下美国经济数据,以评估美联储政策及利率展望,并从中选取我们认为与当前宏观环境最相关的指标进行重点解读。
通胀 | 消费 | 产出 | 劳动力市场 | GDP | 美联储 |
CPI与核心CPI | 消费者情绪指数 | 制造业PMI | 初请失业金人数 | GDP | FOMC会议 |
PPI与核心PPI | 消费信贷 | 服务业PMI | 职位空缺 | GDPNow (预计) | 美联储官员讲话 |
PCE与核心PCE | PCE消费 | 新订单 | 非农就业人数 |
| FedWatch |
| 零售销售 | 运价指数 | 失业率 |
| 预测市场 |
|
|
| 薪资增速 |
| FOMC会议 |
核心结论:从鸽派线索来看,美国消费显露疲态,部分制造业指标开始降温。从鹰派线索来看,最新就业数据韧性超预期,进一步支撑美联储的鹰派基调。9月11日即将发布的CPI数据将成华尔街研判后续利率路径的关键依据。
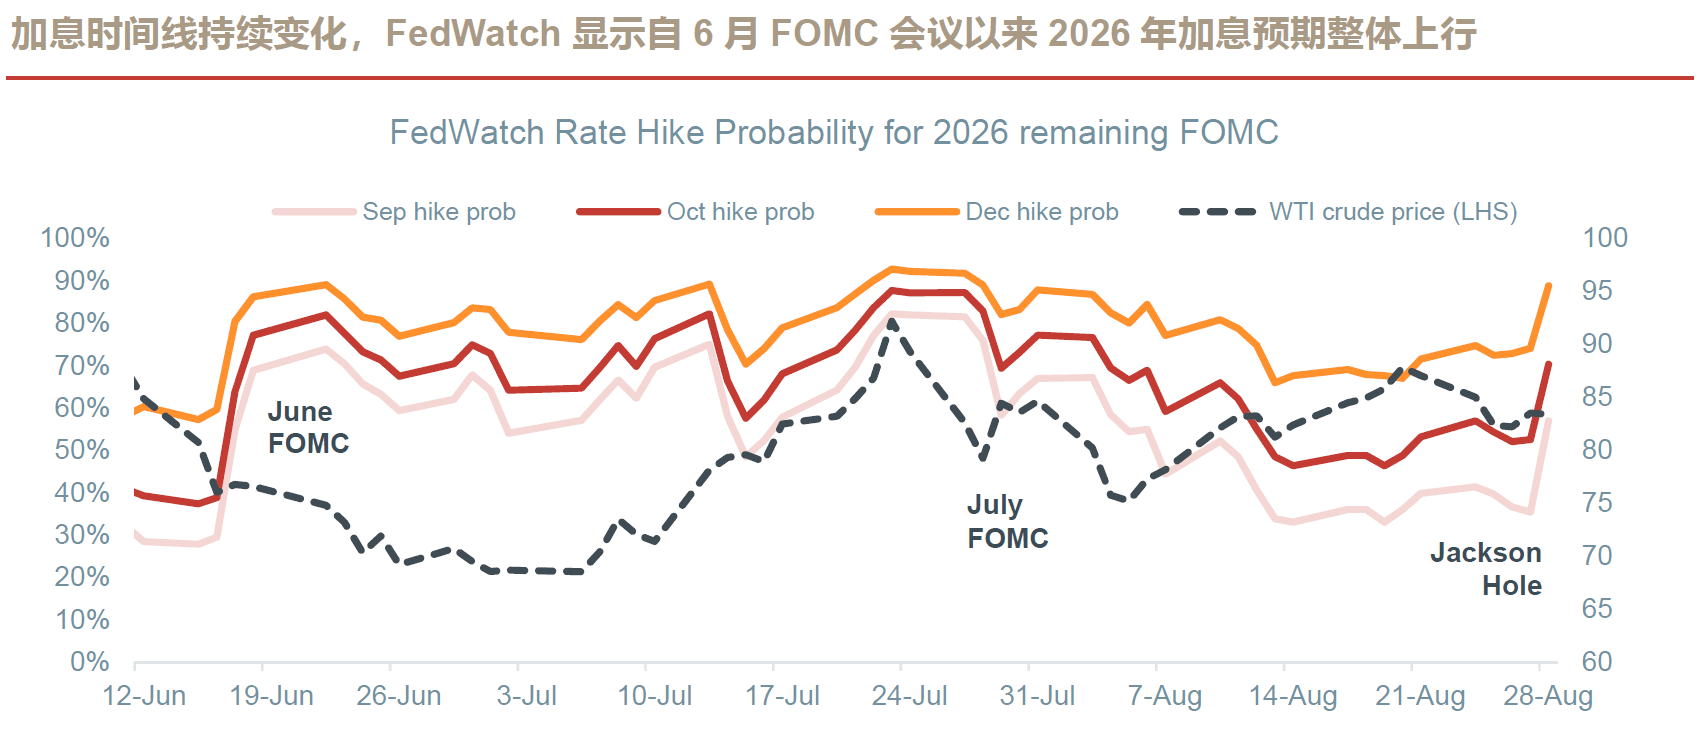
- 劳动力市场数据(8月非农就业)。8月非农新增就业16.2万人,几乎为5.6万人一致预期的三倍,失业率持平于4.1%。市场定价明显偏鹰:FedWatch显示9月加息概率自50%升至60%,黄金下跌1%,美元指数上涨0.2%,10年期美债收益率小幅上行4个基点。
资料来源:彭博、FedWatch
- 通胀(7月CPI与PCE)。7月通胀数据好坏参半,整体通胀放缓的背后暗藏底层粘性。整体CPI回落至3.4%,核心CPI同比降至2.5%,优于预期,暂时缓解市场加息担忧。生产端PPI明显降温至同比5.5%(6月6.6%),核心PPI小幅下行至3.6%。但美联储重点观测的核心PCE稳定在3.3%,略高于3.2%的一致预期,凸显去通胀“最后一公里”仍存在阻力。
- 产出(8月制造业/服务业指数)。8月ISM制造业指数下降1.0点至54.6,低于预期,新订单、产出及就业分项同步走弱。与此相反,ISM服务业指数逆势上行1.3点至55.4,新订单、商业活动与就业分项创下多年高位。制造业整体走弱、名义建筑支出下降0.5%,叠加标普全球服务业PMI下修,预示着2026年下半年工业增长面临下行压力。
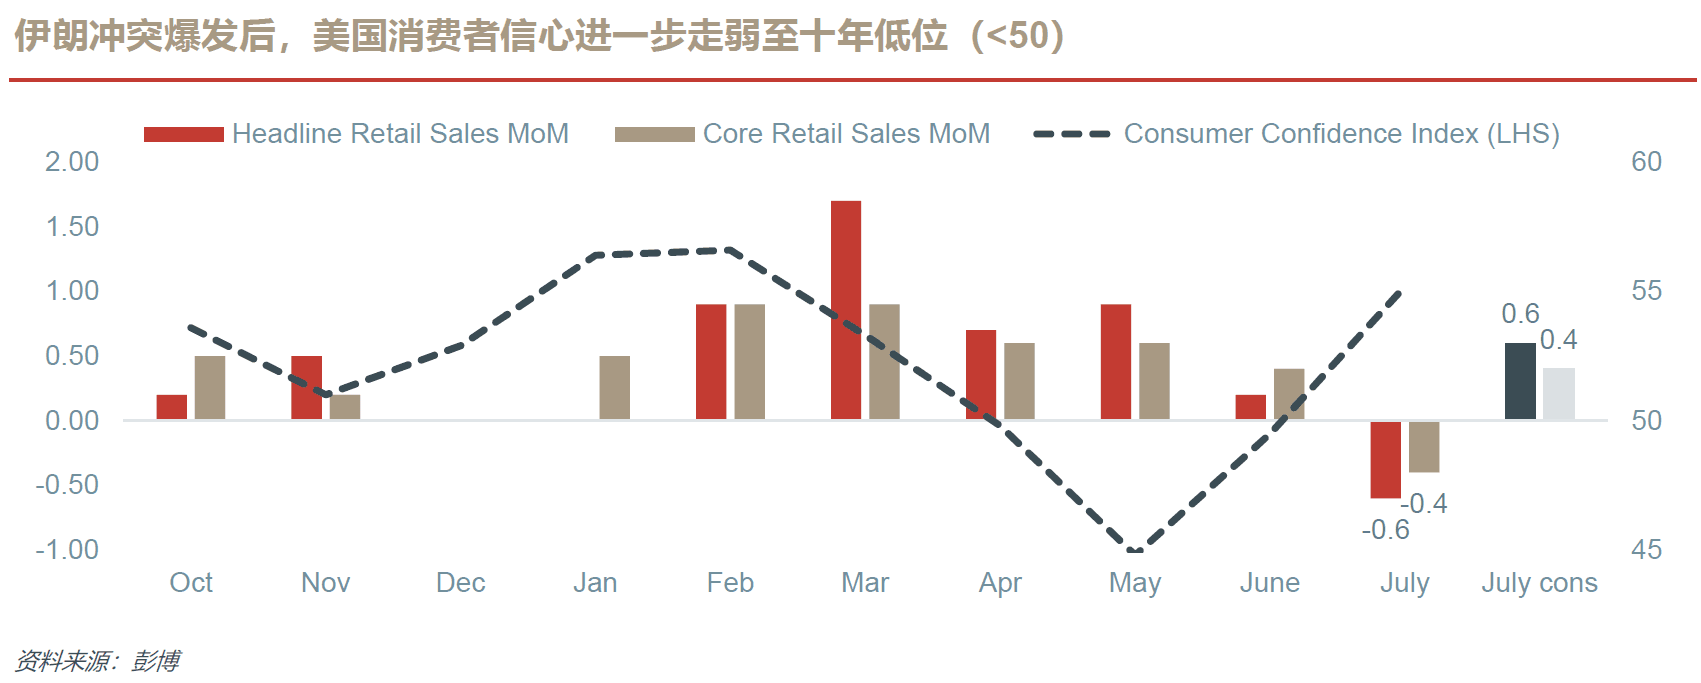
- 消费(7月零售与8月消费者信心)。作为美国GDP增长核心引擎,美国消费显露疲态。整体及核心零售销售额环比分别下降0.6%及0.4%,为年内首次月度下滑,显著低于环比正增长的一致预期。尽管部分走弱可归因于日历扰动(亚马逊会员日),但财政刺激红利消退带来的结构性隐患更值得关注。例如,OBBBA带动退税(同比+17%)形成的消费提振已基本被消化,2026下半年消费上行空间有限。情绪层面,8月密歇根大学消费者信心指数再度回落至51.7,仅略高于50临界值,印证在持续通胀与高利率的双重担忧下,消费者信心依旧脆弱。
美联储vs财政部:殊途同“绳”
美国财长斯科特・贝森特与美联储主席凯文・沃什近期一系列举措与表态引发诸多争议、困惑乃至批评。仅简单预判市场波动率上行并不充分。我们将深入拆解波动的潜在驱动来源,协助投资者为后续市场环境做好应对准备。
- 两“醉汉”各行其道。毋庸置疑,财政部与美联储拥有完全不同的法定使命、政策理念与政策框架。尽管市场普遍将贝森特和沃什视为特朗普的经济幕僚,但二者运作相对独立,一方无法掌控另一方。这推翻了市场的一种主流假设:财政部与美联储将无条件执行特朗普的政策指令。
- 被沉重的绳索栓在一起。这种“独立性”存在前提约束:财政部与美联储虽在法律上相互分离,但政策走向会随宏观环境和政治压力出现冲突或协同。贝森特与沃什深知各自政策会互相扰动,因此必须审慎把握政策力度,妥善应对政策交叉冲击。这根结构性绳索一方面能使财政部与美联储的利益达成统一、提升政策传导效率,另一方面也容易催生矛盾,单边政策的实施效果因此大打折扣。
类别 | 财政部 | 美联储 |
当前理念 | 务实干预、供给端久期管理与经济民族主义 | 弱化前瞻指引(美联储信号)、坚持市场自律优先于政策干预,AI作为结构性生产力驱动因素(长期利好) |
法定权责 | 经济增长与财政偿付能力:债务管理、财政增收、维护金融稳定、提升美国竞争力 | 双重法定使命:物价稳定(通胀目标)与最大化可持续就业 |
目标变量 | 3‑3‑3战略目标:实际GDP增长3%、财政赤字占GDP比重降至3%、原油日产量增加300万桶。 | PCE通胀(~2%目标)、失业率处于可控区间。 |
主要工具 | 债务发行管理、外汇干预、国库一般账户(TGA)管理、税法执行、应急信贷机制、制裁(OFAC)等。 | 联邦基金利率(政策利率)、量化宽松/量化紧缩(QE/QT)、流动性工具(贴现窗口、常设回购工具SRF)、准备金相关调控利率(IORB/ON RRP)等。 |
- 当前阶段分歧大于协同。贝森特与沃什不仅底层政策理念存在差异,出台的举措还可能彼此抵消。举例而言,贝森特近期将长期国债回购规模扩大一倍,依靠增发短期国库券筹措资金;而沃什则在杰克逊霍尔会议释放明显鹰派信号,暗示可能很快加息抗击通胀。
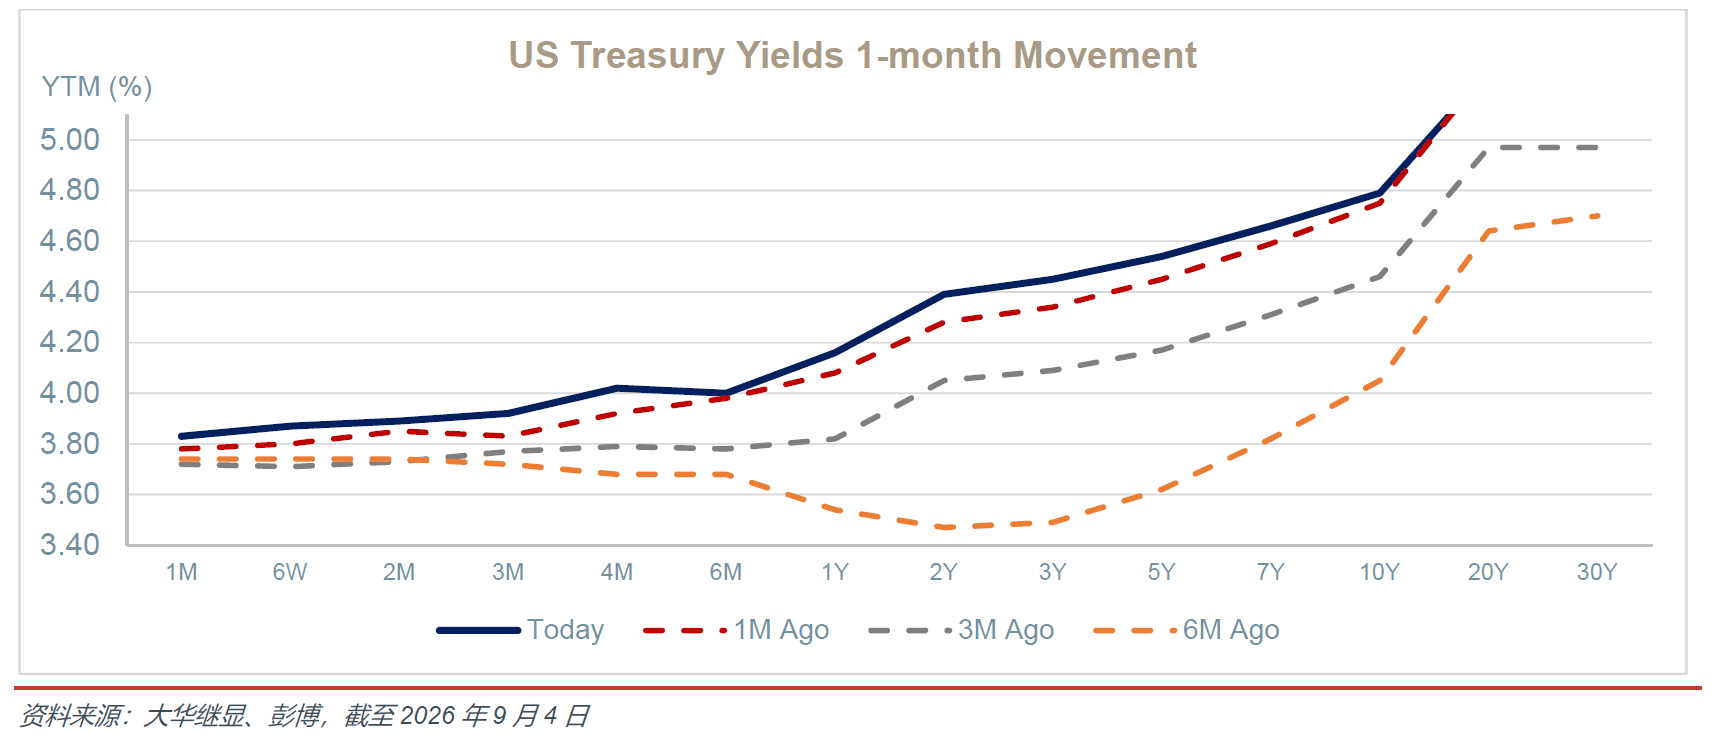
- 短端确定性仍高于长端。尽管财政部与美联储存在政策摩擦,但现阶段短端流动性更佳、走势更可控。沃什计划缩减规模达7万亿美元的美联储资产负债表,或形成偏向短期国库券的结构性调整,有助于吸纳贝森特增加的短债供给。长端变量则更为错综复杂:美联储缩表、高油价、AI融资需求扩张、美国财政隐忧以及债券投资者的警惕情绪,都存在推高收益率的可能性,削弱贝森特债市干预策略的实际效果。
- 殊途同“绳”。让我们回到开篇的核心论点:财政部与美联储当前的政策航向出现分歧,但二者仍被一根双向约束的“绳索”拴在一起。归根结底,约束并统一双方利益的核心因素包括国内经济、市场稳定性以及政策公信力。因此,若后续形势向好,财政部与美联储有望进入政策完全协同的平稳阶段。在此窗口期到来之前,市场震荡仍将持续。
信用观点
美国信用债:AI融资重塑投资级债前景
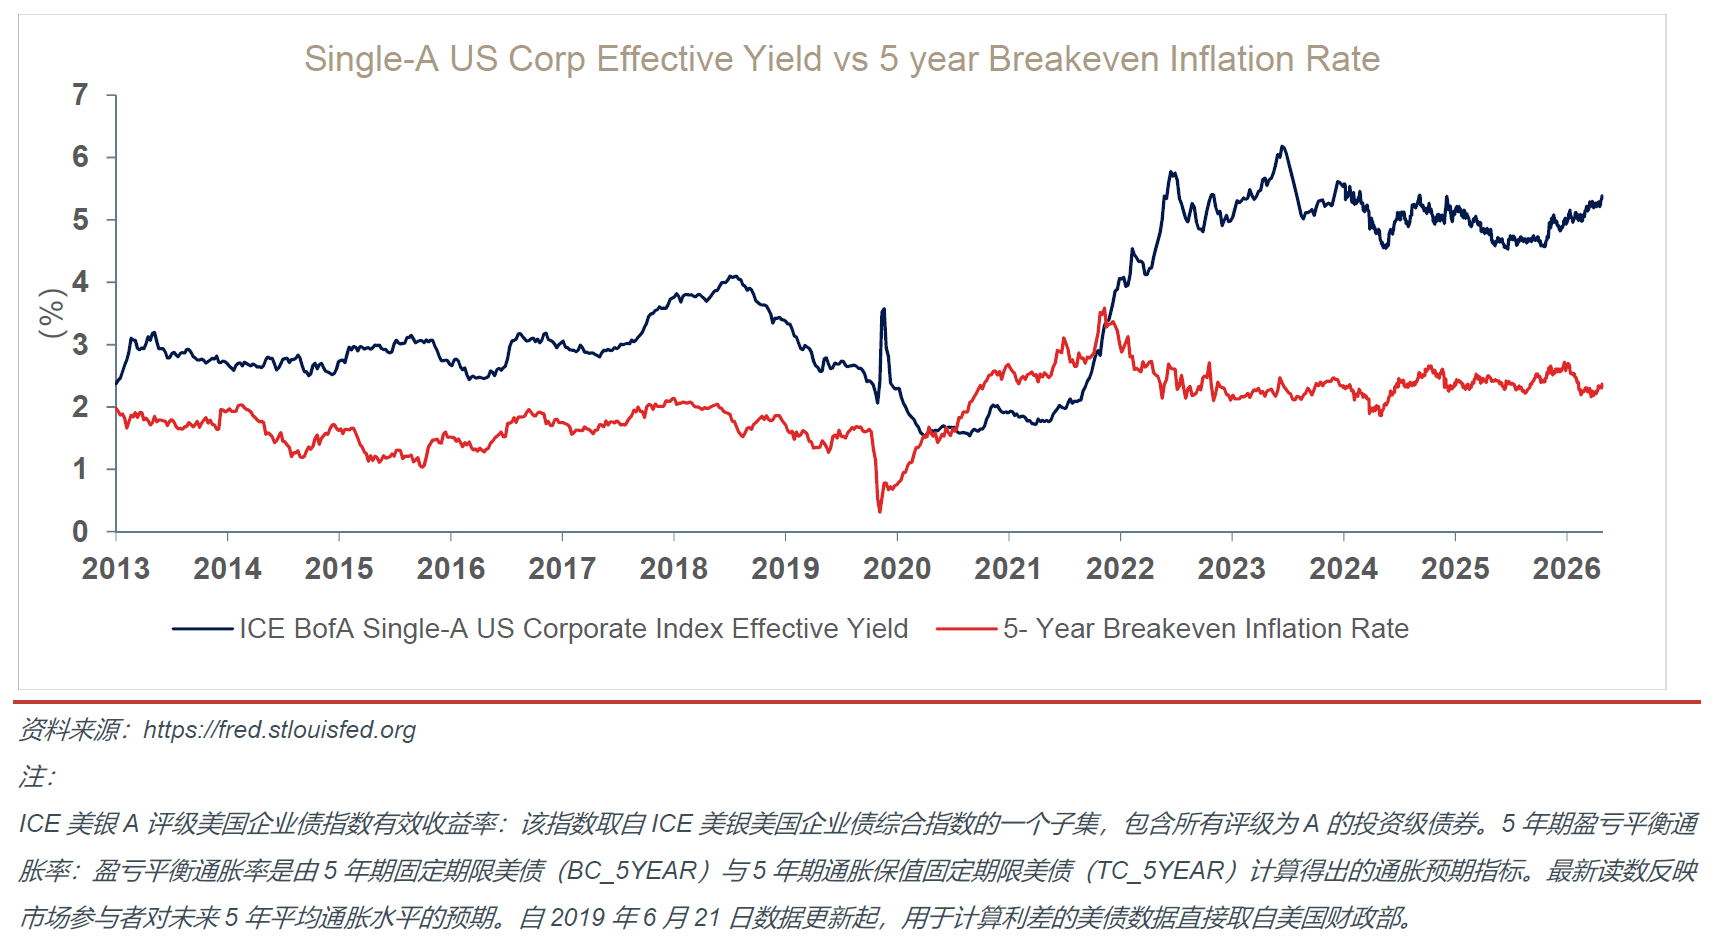
美国信用债市场9月开局整体环境向好。企业盈利与资产负债表构成基本面支撑,违约风险可控,显著低于周期末期信用恶化时的水平。但当前信用利差接近历史低位,叠加高利率长期化环境,依靠利差进一步收窄增厚资本利得的空间有限,票息与收益仍将成为回报的主要驱动力。
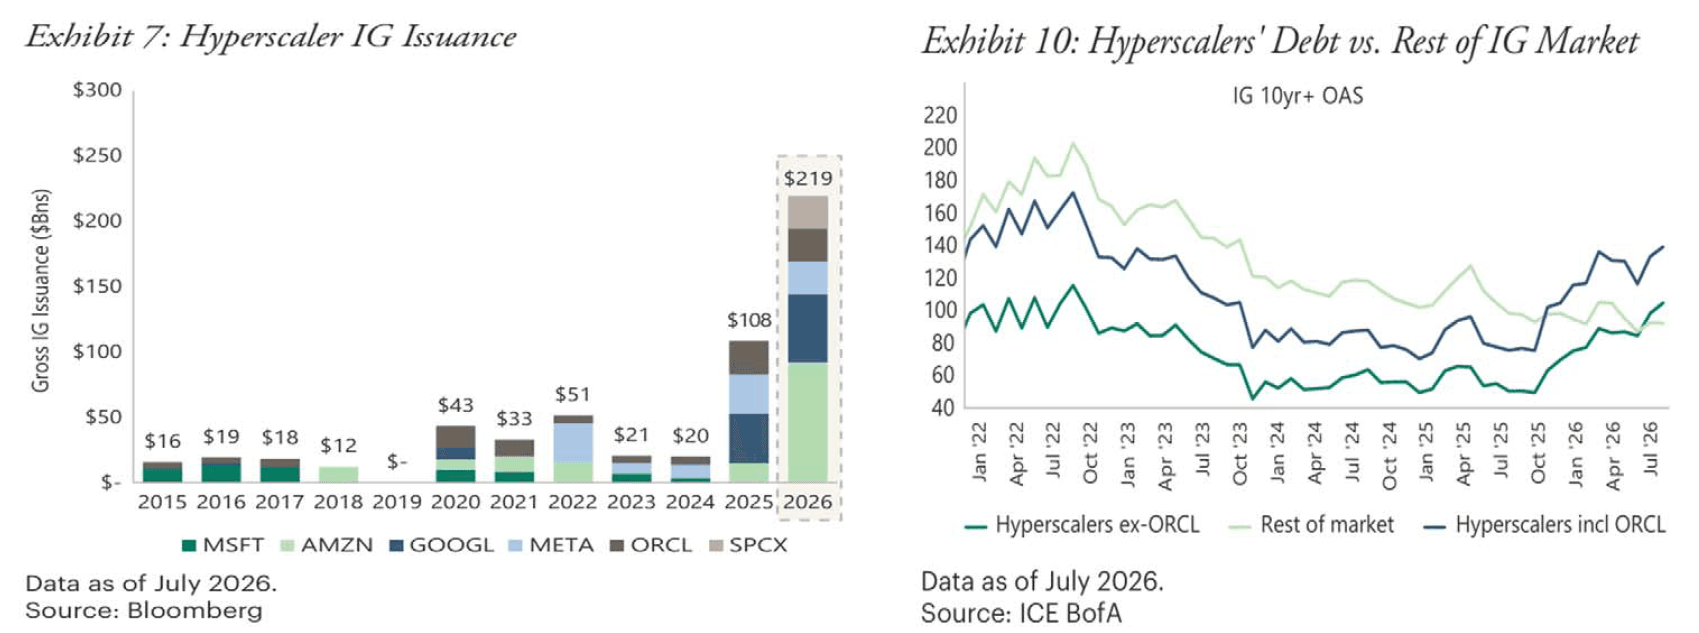
AI投资周期仍是信用债市场重要的结构性变化。2026年美国投资级债券净发行规模接近1万亿美元,亚马逊、Alphabet、微软、Meta、甲骨文与SpaceX合计发债规模超2,000亿美元,募集资金用于AI投资。AI相关债券持续发行推高组合集中度并带来供给压力,投资者或将要求更高风险溢价,高频发债主体和长久期债券面临更大定价压力。
AI融资也在向美元市场之外扩散,Alphabet首次发行澳元袋鼠债为标志性事件。8月Alphabet募资55亿澳元(约39亿美元),创下澳元公司债发行规模历史新高。这笔分六档发行的高级无抵押债券包含3年期、5年期固定利率与浮动利率品种,以及10年期、20年期固定利率债券。最终定价:3年期债券在BBSW/互换利率基础上溢价65个基点,5年期溢价90个基点,10年期溢价133个基点,20年期溢价180个基点,固定票息区间5.20% 6.90%。市场认购需求旺盛,最终订单规模超180亿澳元,约为发行规模的3.3倍。本次发行反映出澳大利亚市场对稀缺高评级科技信用债存在旺盛需求,同时也证明云巨头有能力在非美元市场实现融资渠道多元化。
我们整体仍看好美国信用债,但判断信用利差进一步普遍收窄的空间有限。我们维持对短久期(<3年)、高评级投资级企业债的核心推荐。
亚洲信用债:AI融资格局分化,择券重要性抬升
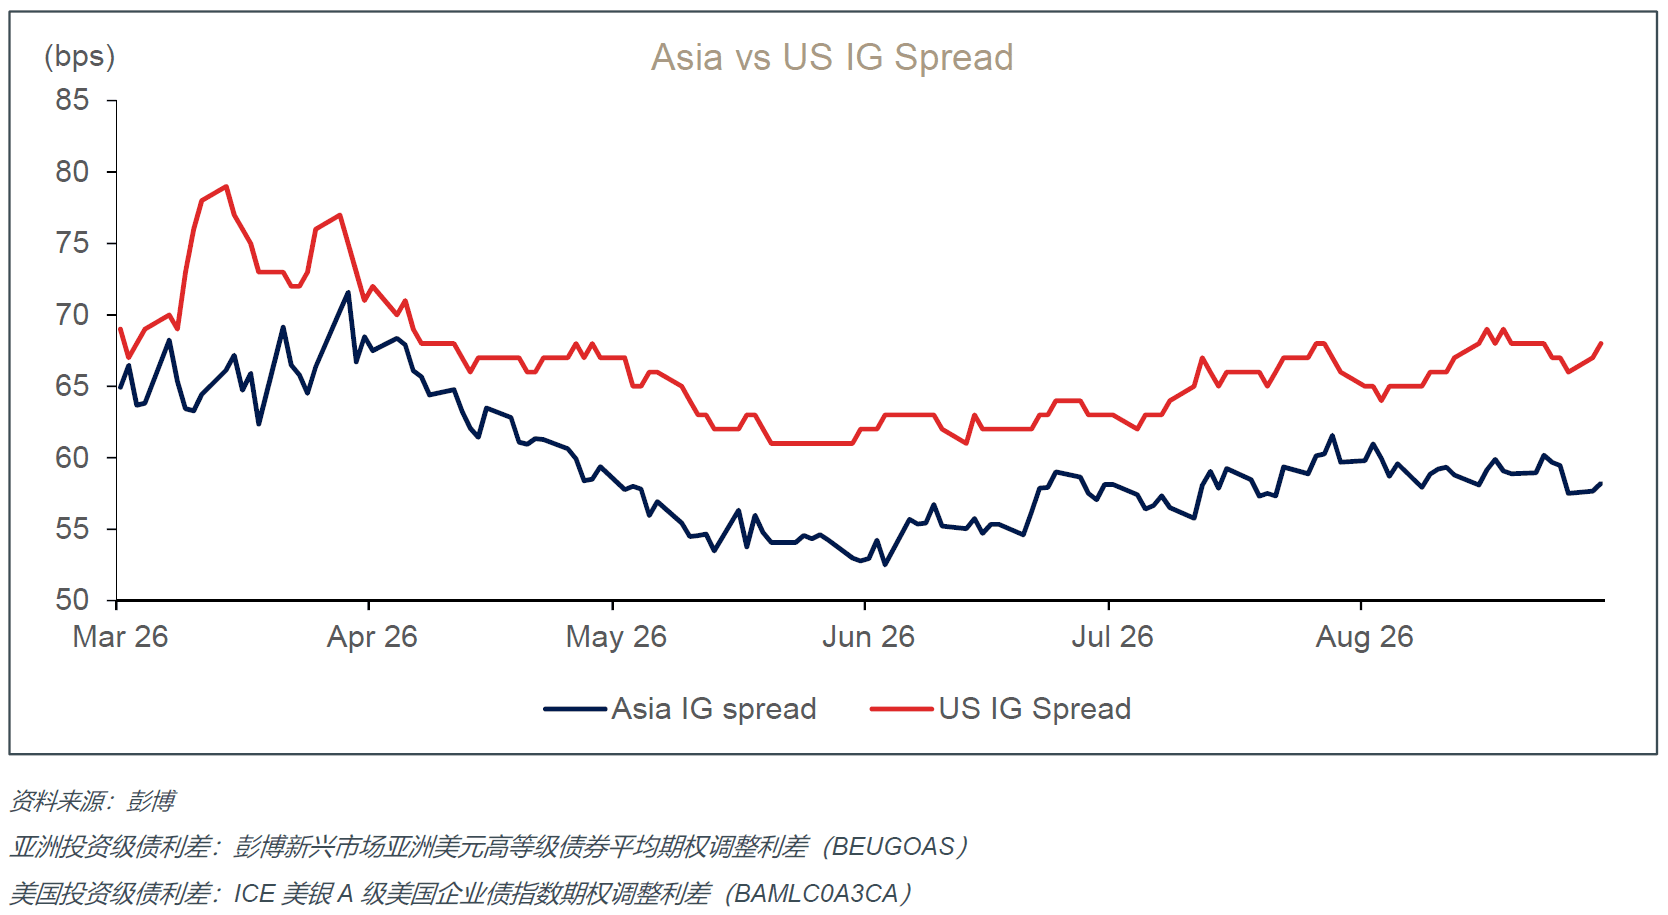
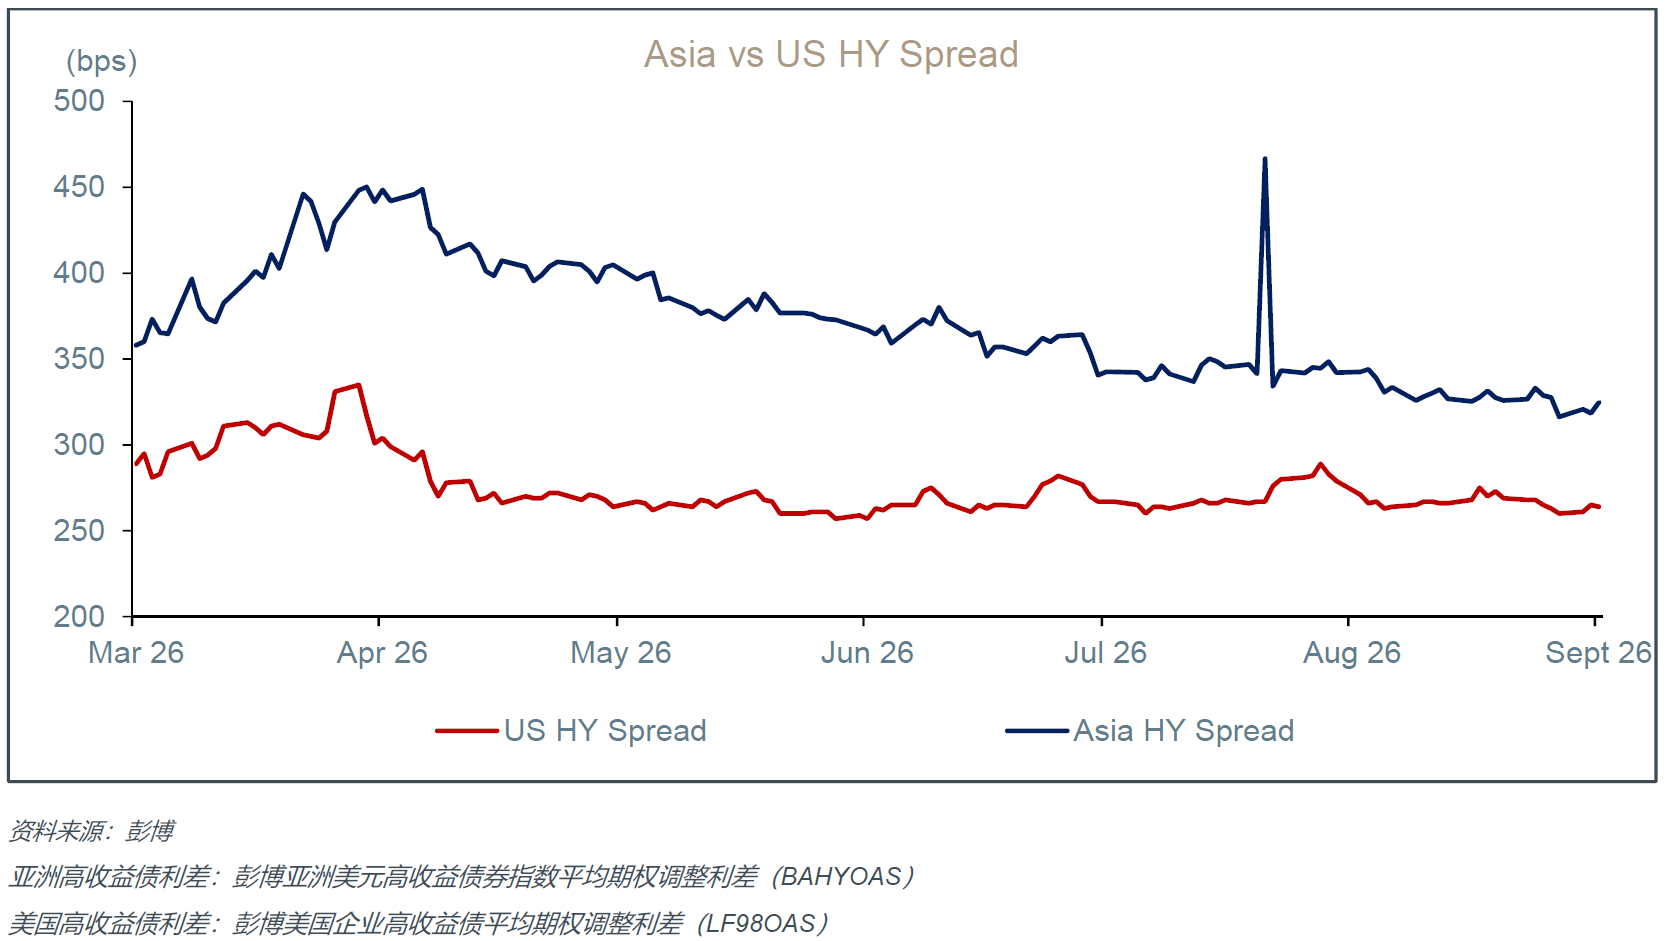
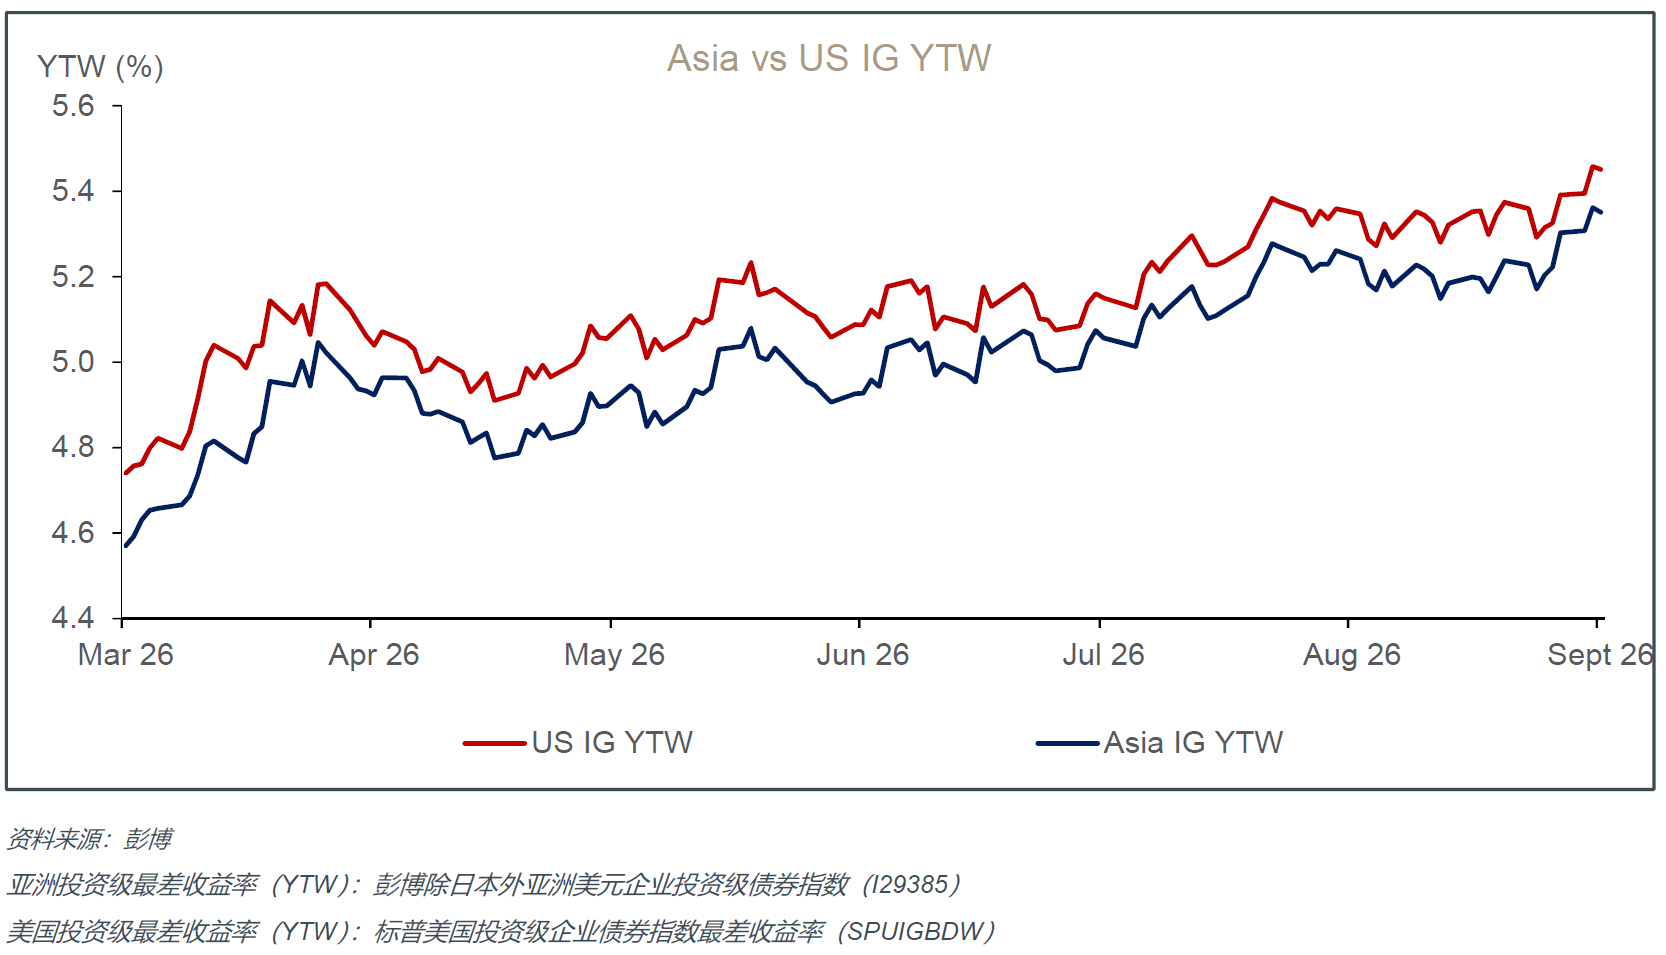
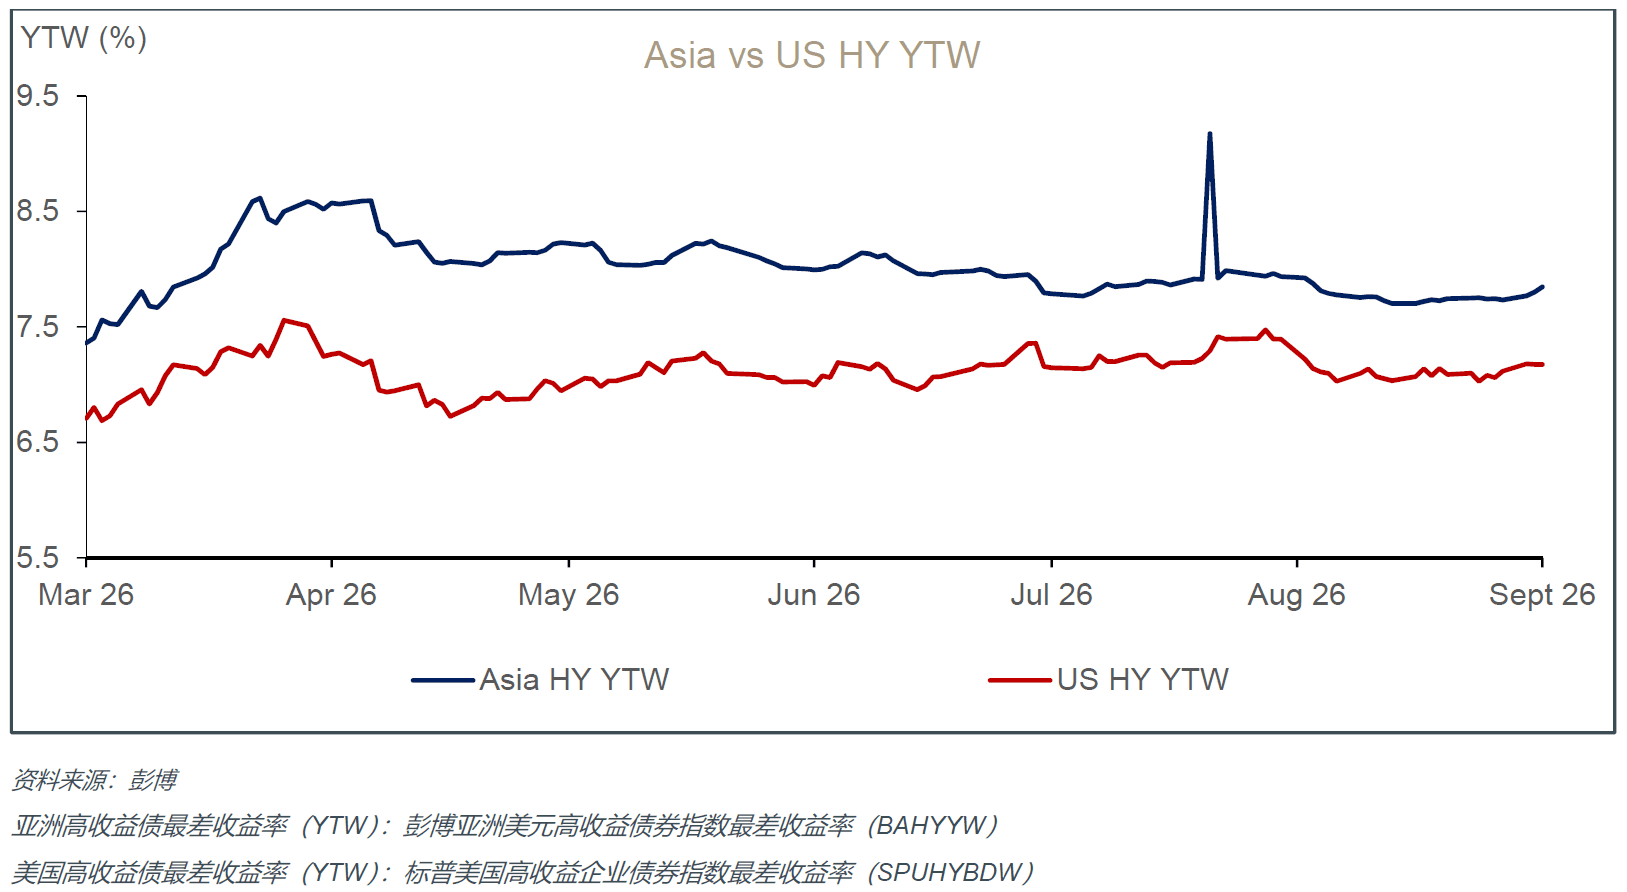
亚洲信用债9月开局基本面整体稳健,但估值偏贵,难以承受利空冲击。8月下旬摩根大通亚洲信用指数(JACI)利差稳定在88bp左右,近期收益主要由美债收益率下行驱动,而非信用利差进一步收窄。我们判断票息收益仍是主要收益来源,不宜博弈利差大幅压缩。
中国科技板块成为亚洲投资级债内部分化的重要来源。预计至2030年,中国头部互联网企业AI及相关资本开支投入规模超3,250亿美元,巨额投资持续拖累自由现金流。阿里巴巴完成800亿港元配股,凸显融资压力,大规模AI投入叠加净现金储备下滑,对外融资依赖上升,其债券易受新增供给冲击。腾讯AI投资策略更为务实,经常性现金流充裕,游戏与广告收入多元化,基本面更占优,仅阶段性受到AI资本开支拖累。百度内生现金生成能力偏弱,但可借助银行信贷、租赁业务以及AI芯片子公司拓宽融资渠道。整体而言,中国科技板块并非全线走弱,而是信用资质显著分化,长久期债券存在估值重定价风险。
SK海力士诠释了AI信用叙事的另一面。阿里巴巴等云巨头持续投入AI基建,而SK海力士则直接受益于高带宽内存(HBM)、先进DRAM与企业级固态硬盘(SSD)等AI数据中心核心组件的需求增长。彭博行业研究预计,在强劲HBM需求与存储涨价的推动下,其2027年营业利润将较一致预期高出10-11%。盈利改善直接带动信用指标走强。继穆迪上调评级至A3后,标普8月将SK海力士评级由BBB+提升至A /展望正面。这与资本密集型云巨头面临的信用担忧形成明显反差。SK海力士案例的启示清晰:投资者应当区分两类企业,一类承担AI巨额资本投入,另一类则依托核心零部件供应兑现AI红利。
我们整体仍看好亚洲信用债,但建议提高择券标准。我们看好高评级亚洲投资级债券、中短久期票息资产、防御型金融债以及SK海力士等直接受益于AI资本扩张的发债主体。另一方面,我们对长久期中资云巨头债券(AI资本开支削弱自由现金流)、估值偏高的高级金融债,以及存在持续外部融资需求的发行主体保持谨慎。
亚太地区主要主权利率监测
Region | 2 Year | 5 Year | 10 Year | 30 Year |
Australia | 4.77 | 4.79 | 5.17 | 5.64 |
China | 1.21 | 1.39 | 1.68 | 2.16 |
China (usd) | NA | NA | NA | NA |
India | 6.24 | 6.45 | 6.96 | 7.54 |
Indonesia | 6.62 | 6.90 | 7.10 | 7.18 |
Indonesia (USD) | 4.23 | 5.10 | 5.71 | 6.03 |
Japan | 1.83 | 2.26 | 2.94 | 4.05 |
Malaysia | NA | 3.53 | 3.91 | 4.28 |
New Zealand | 3.58 | 4.18 | 4.76 | 5.42 |
Pakistan | NA | 11.76 | 12.12 | NA |
Philippines | 6.06 | 7.02 | NA | NA |
Philippines (USD) | 4.37 | 4.90 | 5.61 | NA |
Singapore | 1.68 | 2.01 | 2.36 | 2.44 |
South Korea | 3.66 | 4.10 | 4.35 | NA |
South Korea (USD) | 4.22 | 4.37 | NA | NA |
Taiwan | 1.67 | 1.82 | 1.85 | 2.09 |
Thailand | 1.15 | 1.60 | 2.19 | 3.18 |
资料来源:彭博,数据截至2026年9月3日
信用利差
信用债收益率
债券ETF与基金雷达
投资债券基金的主要风险
- 市场风险:利率上行、信用利差扩大、经济放缓或发行主体特定事件风险,均可能导致债券价格下跌。
- 货币风险:汇率波动可能显著影响回报。
o 美元走强可能提升以新加坡元计价的未对冲外币资产价值。
o 美元走弱可能抵消甚至逆转债券价格的涨幅。
- 对冲份额类别:许多基金提供新加坡元、欧元、澳元、港元或人民币对冲份额类别,以降低汇率波动,让投资者更聚焦于信用和久期敞口。
高收益敞口
- 全球债券基金通常可能同时持有投资级与高收益债券。
- 高收益债券伴随更高的违约风险、宏观风险及流动性风险。
- 这意味着更高的价格波动与潜在本金亏损,若持有未对冲敞口且对应币种贬值,相关风险将进一步放大。
关键考量
- 过往表现不代表未来回报。
- 收益率不应作为投资决策的唯一依据。
- 若希望顺应去美元化趋势、降低美元资产配置比例,对比:
o 对冲份额类别
o 对冲成本
o 整体风险–收益特征
债券ETF与基金雷达:核心要点
Name | Category | Duration Type | Expense | Effective Duration | Average Yield | Credit Quality |
Vanguard Short-Term Corporate Bond ETF (VCSH US) | Investment Grade ETF | Short | 0.03% | 2.7 | 5.00% | 54.79% in A rated and above 45.23% in BBB rated Average Quality – A- |
iShares Core U.S. Aggregate Bond ETF (AGG US) | Investment Grade ETF | Intermediate | 0.03% | 5.78 | 5.06% | 87.89% in A rated and above 11.56% in BBB rated Average Quality – AA |
iShares iBoxx $ Investment Grade Corporate Bond ETF (LQD US) | Investment Grade ETF | Long | 0.14% | 7.71 | 5.72% | 59.36% in A rated and above 39.87% in BBB rated Average Quality – A- |
HSBC Short Duration Bond Fund | Investment Grade UT | Short | 0.70% | 2.57 | 4.90% | 43.49% in A rated and above 44.75% in BBB rated 10.32% in HY Average Quality – A-/BBB+ |
PIMCO GIS Income Fund | Investment Grade UT | Intermediate | 1.45% | 6.73 | 7.32% | 80.60% in A rated and above 9.90% in BBB 9.20% in HY Average Quality – AA- |
Fidelity US Dollar Bond Fund | Investment Grade UT | Long | 1.03% | 6.6 | 5.03% | 81.18% in A rated and above 12.84% in BBB 2.33% in HY Average Quality – AA- |
资料来源:彭博、晨星、iShares和Vanguard,数据截至2026年9月3日。在美国上市的ETF可能使投资者收到的全部股息面临30%预扣税。更多详情请咨询税务顾问。
债券ETF与基金雷达(续):表现数据
Fund Name | ISIN / Ticker | Currency | 1 Month Total Return (%) | YTD Total | 1 Year Total Return (%) |
HSBC GIF Global Short Duration Bond Fund | LU1163226092 | USD | 0.03 | 1.48 | 3.06 |
LU1272399756 | SGD | -0.20 | -0.27 | 0.28 | |
LU2639850283 | EUR | -0.09 | 0.29 | 1.10 | |
PIMCO GIS Income Fund | IE00B7KFL990 | USD | -0.22 | -0.17 | 2.78 |
IE00B9HH6X13 | SGD | -0.38 | -1.87 | 0.04 | |
IE00B84J9L26 | EUR | -0.35 | -1.32 | 0.85 | |
Fidelity Funds - US Dollar Bond Fund | LU0261947682 | USD | -0.22 | -1.75 | -0.33 |
LU2605879787 | SGD | -0.47 | -3.46 | -3.11 | |
LU2730164063 | EUR | -0.34 | -2.93 | -2.29 | |
Vanguard Short-Term Corporate Bond ETF (VCSH US) | VCSH US | USD | 0.02 | 0.94 | 2.58 |
iShares Core U.S. Aggregate Bond ETF (AGG US) | AGG US | USD | -0.09 | -0.41 | 1.56 |
iShares iBoxx $ Investment Grade Corporate Bond ETF (LQD US) | LQD US | USD | -0.30 | -1.39 | 0.55 |
Bloomberg US Aggregate Total Return Index | LBUSTRUU Index | USD | -0.04 | -0.49 | 1.60 |
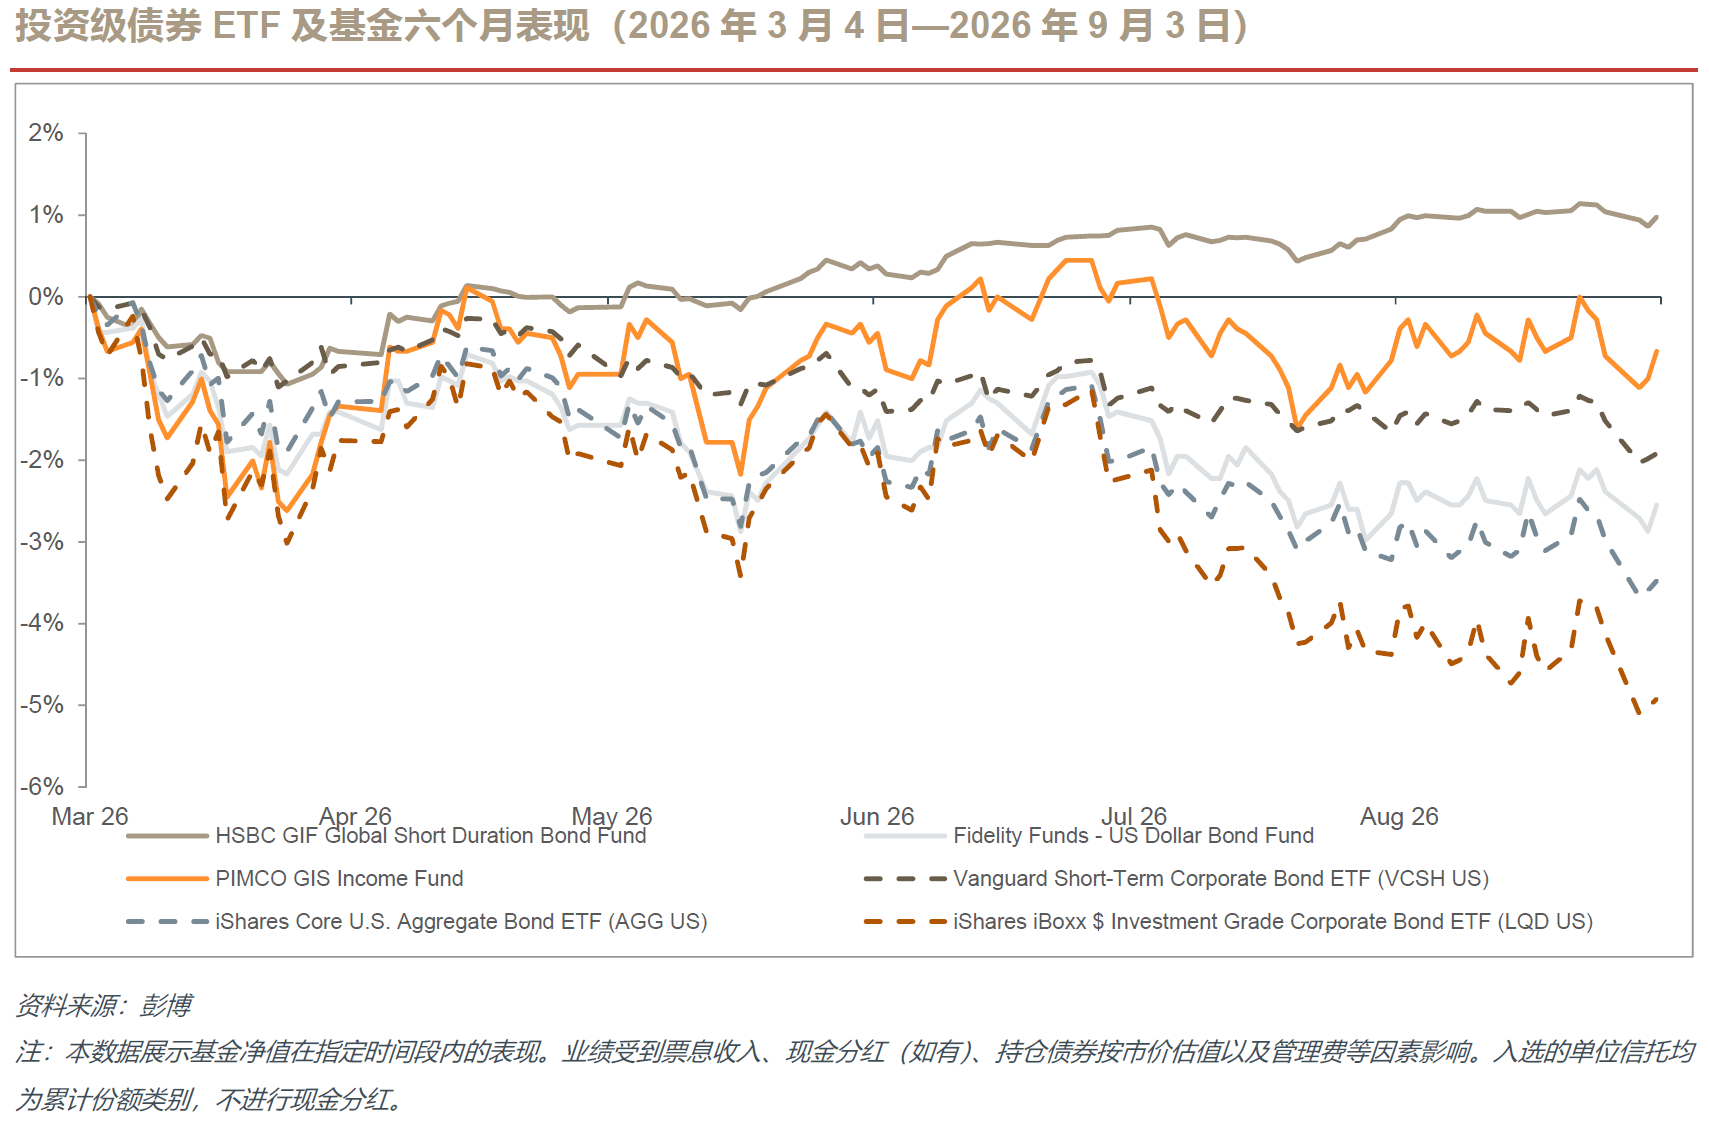
资料来源:彭博,数据截至2026年9月3日。单位信托采用累计份额类别(不派发基金现金股息),ETF采用股息再投资口径计算收益。
术语表
平均票面利率(Average Coupon):债券组合中各类债券票面利率的加权平均值。
平均信用质量(Average Credit Quality):债券组合中各债券信用评级的加权平均值(参见“平均评级”定义)。
平均久期(Average Duration):债券组合价值对利率变动的敏感度。久期越长,利率敏感性越高。
平均评级(Average Rating):债券组合中所有债券评级的加权平均值。例如,某组合25%为AAA级、25%为 BBB级、50%为CCC级,则加权平均信用评级为B+(介于BBB级与CCC级之间)。
平均到期收益率(Average Yield To Maturity):使债券组合未来所有现金流现值等于当前组合价格所要求的回报率。
最差收益率(Yield To Worst, YTW):债券在完全遵守合约条款且不违约的情况下,可能实现的最低收益率。基于最早赎回或清偿日期计算(假设发行人行使赎回权提前偿还本金)。
有效久期(Effective Duration):同“平均久期”。
有效到期日(Effective Maturity):对于含赎回、回售或提前偿付条款的债券,用于替代其最终到期日的计算日期。
当期收益率(Running Yield):票面利率除以债券组合市价所得的收益率。与到期收益率不同,当期收益率不考虑债券市价与到期赎回价的差异。
仅供专业投资者、合格投资者或相关人士(CKA)参阅
CIO摘要
- 劳动力市场保持韧性,12月加息仍具可能。最新就业数据表现超预期坚挺,支撑美联储鹰派基调。我们的基准假设是美联储12月加息的概率高于9月。
- 美联储vs财政部:各行其道的两“醉汉”。财政部长贝森特与美联储主席沃什当下政策路径明显分化,推高长端利率不确定性,也进一步巩固我们增配短端资产的偏好。
- 但二者仍拴在一根绳上。贝森特与沃什深知各自政策会互相扰动,因此必须审慎把握政策力度,妥善应对政策交叉冲击。这根“绳”决定了任何一方都不能过度激进,否则会损害双方共同目标。当投资者完全忽视这种制衡关系时,市场或将迎来买入窗口,但目前时机尚未到来。
- AI主题股债二选一,不宜同时超配。Alphabet首次发行澳元袋鼠债,凸显美国云巨头在非美元市场分散融资的能力。这可能演变为新兴趋势,进一步放大AI集中度风险。
- 宏观环境充满不确定性,叠加AI集中度风险不断上升,我们维持对短久期、高评级、投资级债券的核心推荐。
- 本月焦点债券:BABA 4.875% 2030年5月26日到期
债券雷达
以下是我们产品团队定期更新的热门投资级(IG)债券清单,仅供参考。需特别说明的是,此类债券仅作信息参考之用,并不构成我们的正式投资建议。如需了解更多详情,请联系我们的固定收益及信贷专员陈顺超 (benjamintan@uobkh.com)。
亚洲非金融企业
Company | Bond Name | ISIN | Current Price (Sep 3) | YTM (%) | Duration (y) | 6M Performance (%) |
Abu Dhabi | TAQAUH 4.375% | XS2600246552 | USD 98.73 | 4.94 | 2.22 | -1.61 |
Abu Dhabi’s government-owned energy and water conglomerate with the world’s largest single-site solar power plant and other renewables. | ||||||
Singtel | STSP 2.375% | XS2046591413 | USD 93.68 | 4.68 | 2.82 | -1.21 |
State-owned telecom. Largest in Singapore, second in Australia (Optus) and India (Bharti Airtel). Invests in 5G, cloud, and cybersecurity. | ||||||
Petronas | PETMK 3.50% 21 Apr 2030 | USY68856AT38 | USD 95.25 | 4.95 | 3.31 | -2.33 |
Malaysia’s fully government-owned national oil company, operating across the entire oil and gas value chain with strong state support, robust cash generation, and a globally diversified asset base. | ||||||
TSMC | TAISEM 4.125% | US872898AG66 | USD 98.69 | 4.66 | 2.43 | -1.59 |
Top semiconductor manufacturer with leading technologies like the first commercial extreme-ultraviolet lithography (EUV). | ||||||
Alibaba | BABA 4.875% | USG01719AK24 | USD 100.01 | 4.87 | 3.33 | -2.94 |
China’s largest e-commerce company with around 50% market share and a growing user base. Leading cloud provider in Asia Pacific. | ||||||
CNPC Global | CNPCCH 2% | XS2179918037 | USD 90.8 | 4.67 | 3.56 | -1.95 |
| China's government-owned largest oil and gas producer and supplier. One of the world's major oilfield service providers and a globally reputed contractor in engineering construction. | |||||
CNOOC FINANCE | CNOOC 2.875% | US12625GAF19 | USD 94.72 | 4.74 | 2.85 | -1.69 |
| China's state-owned and largest producer of offshore crude oil and natural gas. Known for its pioneering deepwater drilling capabilities. | |||||
Meituan
| MEITUA 4.625% 2 Oct 2029 | USG59669AF11 | USD 98.3 | 5.23 | 2.77 | -2.31 |
| Leading Chinese e-commerce platform for local services, offering a wide range of services such as food delivery, travel booking, and entertainment through its app. | |||||
JD.com
| JD 3.375% 14 Jan 2030 | US47215PAE60 | USD 95.75 | 4.76 | 3.11 | -1.93 |
One of China’s largest e-commerce platforms, focusing on high-quality, branded products, and in-house logistics, making it the leader in categories like electronics and home appliances. | ||||||
Xiaomi
| XIAOMI 3.375% 29 Apr 2030 | USY77108AA93 | USD 94.58 | 5.02 | 3.34 | -1.96 |
| Leading Chinese technology company that designs smartphones, smart devices, and IoT products, recently expanding into electric vehicles | |||||
SK Hynix
| HYUELE 4.375% 9 Nov 2030 | USY8085FBZ28 | USD 97.32 | 5.12 | 3.55 | -3.29 |
| SK Hynix is the world’s second-largest memory chipmaker and a key beneficiary of the global AI-driven demand for high-bandwidth memory. | |||||
Singapore Airlines
| SIASP 3.5% | SGXF10397887 | SGD 104.39 | 2.40 | 3.90 | -1.17 |
| Temasek-controlled, Singapore’s flag carrier with a young fleet and robust liquidity, benefitting from quasi-sovereign support. Operating a full-service carrier (SIA) and low-cost carrier (Scoot) across 130-plus destinations. | |||||
MPACT Treasury
| MCTSP 4.25% 29 Mar 2030 | SGXF59943971 | SGD 106.31 | 2.39 | 3.25 | -1.58 |
| Temasek-backed REIT, owning flagship VivoCity and diversified Grade-A assets across Singapore, Hong Kong and North Asia, providing resilient distributions with organic growth upside. | |||||
Starhub
| STHSP 2.48% 08 Jan 2031 | SGXF30667780 | SGD 99.96 | 2.49 | 4.07 | -0.76 |
| Integrated Singapore telco spanning mobile, broadband, pay-TV and enterprise-ICT services, leveraging 5G and digital platforms to stabilise cash flows and reignite growth. Majority-owned by ST Telemedia, a wholly owned Temasek portfolio company. | |||||
资料来源:彭博。所有价格与收益率仅为指示性报价,仅供参考。如需进一步信息,请联系大华继显产品团队。
欧美非金融企业
Company | Bond Name | ISIN | Current Price (Sep 3) | YTM (%) | Duration (y) | 6M Performance (%) |
Microsoft | MSFT 1.35% | USU59340AK20 | USD 88.17 | 4.60 | 3.81 | -2.28 |
Big Tech leader with businesses in operating system, search engine, cloud computing, and artificial intelligence etc. A combination of stable cash flows and new growth opportunities. | ||||||
Meta | META 4.8% | US30303M8M79 | USD 99.61 | 4.92 | 3.30 | -3.37 |
Previously Facebook, the origin of today's social media trend. With a growing user base of nearly 4 billion (half of the world population). | ||||||
Nvidia
| NVDA 2.85% 01 Apr 2030 | US67066GAF19 | USD 93.39 | 4.89 | 3.29 | -2.72 |
A prominent chipmaker that designs graphics processing units (GPUs) for gaming and artificial intelligence. It held a dominant position in the graphics cards industry with an 80.2% market share in 2Q23. | ||||||
Costco | COST 1.6% | US22160KAP03 | USD 89.7 | 4.72 | 3.43 | -1.78 |
World's 3rd largest retailer which operates a chain of membership-only big-box warehouse club retail stores. | ||||||
Procter & Gamble | PG 4.35% | US742718GF07 | USD 99.79 | 4.44 | 2.25 | -2.30 |
Founded more than 180 years ago with operations in over 70 countries. Specialize in a wide range of personal health/consumer health, personal care, and hygiene products. | ||||||
Nestle | NESNVX 4.65% | USU6408XAK55 | USD 99.95 | 4.67 | 2.30 | -2.33 |
World's largest food and beverage company with over 2,000 brands and a presence in 188 countries. | ||||||
Pepsico | PEP 4.1% | US713448GL64 | USD 98.96 | 4.57 | 2.21 | -1.87 |
Second-largest food and beverage business in the world based on net revenue, profit, and market capitalization. | ||||||
Coca-Cola Co | KO 2.125% | US191216CM09 | USD 93.1 | 4.61 | 2.83 | -1.66 |
Distributes the world's best-selling soft drink in over 200 countries, outselling its nearest competitor Pepsi by a significant margin. | ||||||
Pfizer | PFE 3.45% | US717081ET61 | USD 97.22 | 4.63 | 2.35 | -1.85 |
Founded in the mid-19th century, American drug maker with a strong and diversified drug portfolio. Biggest pharmaceutical company in the world based on the 2022 revenue. | ||||||
BP Capital America | BPLN 3.723% | US05565QDH83 | USD 97.98 | 4.69 | 2.09 | -1.63 |
Key player in the oil and gas industry that operates in 70 countries. It produces 2.3 million barrels of oil equivalent per day in 2022. | ||||||
McDonald's Corp | MCD 4.8% | US58013MFU36 | USD 100.24 | 4.66 | 1.76 | -1.80 |
The biggest fast-food chain in the world operating in the US and internationally with over 40,000 restaurants worldwide. | ||||||
Walt Disney | DIS 7.625% | USU25497AU95 | USD 106.68 | 4.45 | 2.02 | -2.68 |
Founded in 1923, a leading entertainment and production company known for its iconic animated film theme parks, streaming services, and media networks, creating magical experiences for audiences worldwide. | ||||||
JOHNSON & JOHNSON | JNJ 4.9% | US478160CV47 | USD 100.88 | 4.68 | 4.01 | -3.41 |
Johnson & Johnson manufactures health care products and provides related services for the consumer, pharmaceutical, and medical devices and diagnostics markets. The Company sells products such as skin and hair care products, acetaminophen products, pharmaceuticals, diagnostic equipment, and surgical equipment in countries located around the world. | ||||||
资料来源:彭博。所有价格与收益率仅为指示性报价,仅供参考。如需进一步信息,请联系大华继显产品团队。
全球金融机构
Company | Bond Name | ISIN | Current Price (Sep 3) | YTM (%) | Duration (y) | 6M Performance (%) |
JP Morgan | JPM 4.005% | US46647PAR73 | USD 100.68 | 4.75 | 2.73 | -1.92 |
a) Largest bank in the world by market cap b) CET1 (Common equity Tier 1) ratio at 14.3% in 1Q26. Down 0.2% from 4Q25. Attention: c) Senior Unsecured bond, with respect to the exercise of US bail-in power. d) Resettable features. | ||||||
Bank of America
| BAC 2.087% | US06051GJZ37 | USD 98.14 | 4.75 | 2.39 | -1.36 |
a) The 2nd largest bank, globally, majoring in commercial banking, wealth management and investment banking b) CET1 ratio at 11.2% in 1Q26. Down 0.2% from 4Q25. Attention: c) Senior Unsecured bond, with respect to the exercise of US bail-in power. d) Resettable features. | ||||||
UBS AG | UBS 5.428% | USH42097EV54 | USD 100.87 | 5.04 | 2.24 | -2.33 |
a) One of the most well-established and influential banks globally. Foremost bank in Switzerland, focusing on wealth management, asset management and investment banking. b) CET1 ratio at 14.7% in 1Q26. Up 0.3% from 4Q25. Attention: c) Senior Unsecured bond, with respect to the exercise of Swiss bail-in power. d) Resettable features. | ||||||
HSBC Holdings | HSBC 4.583% | US404280BT50 | USD 101.33 | 4.85 | 3.04 | -1.88 |
a) Bank giant with unique historical and business links to East Asia and a highly multinational footprint b) CET1 ratio at 14.0% in 1Q26. Down 0.9% from 4Q25. Attention: c) Senior Unsecured bond, with respect to the exercise of UK bail-in power. d) Resettable features. | ||||||
BNP Paribas | BNP 5.27% | FR001400JF24 | USD 101.23 | 4.88 | 3.04 | -1.61 |
a) Flagship bank in France, 2nd largest bank in Europe by asset. b) CET1 ratio at 12.8% in 1Q26. Up 0.2% from 4Q25. Attention: c) Senior Preferred bond, with respect to the exercise of France bail-in power. d) Resettable features. | ||||||
Standard Chartered
| STANLN 4.299% 13 Jan 2030 | XS3258535908 | USD 98.23 | 5.10 | 2.19 | -1.76 |
a) Prominent international banking group with a strong presence across Asia, Africa, and the Middle East. b) CET1 ratio at 13.4% in 1Q26. Down 0.7% from 4Q25. Attention: c) Senior Unsecured bond, with respect to the exercise of UK bail-in power. d) Resettable features | ||||||
National Australia Bank | NAB 4.308% 13 Jun 2028 | US632525CJ86 | AUD 98.42 | 5.07 | 3.31 | -0.37 |
a) Australia’s largest business bank (“Big Four”) b) CET1 ratio at 11.48% in 1Q26. Down 0.22% from 4Q25. Attention: c) Senior Unsecured bond | ||||||
FWD Group Holdings
| FWDGHD 7.784% 6 Dec 2033 | XS2730013104 | USD 111.4 | 5.83 | 5.51 | -4.58 |
Hong Kong–headquartered life insurer operating across 10 Asian markets, including Hong Kong, Singapore, Japan, Thailand, Indonesia, and the Philippines, serving over 34 million customers with diversified life, health, and general insurance products. | ||||||
Westpac Banking Corporation
| WSTP 5.151% 12 Feb 2031 | AU3CB0331148 | AUD 100.21 | 5.09 | 3.96 | n.a. |
a) Headquartered in Sydney and Australia’s oldest bank (“Big Four”) b) CET 1 ratio at 12.42% in 1H26. Up 0.18% yoy. Attention: c) Senior Unsecured bond | ||||||
资料来源:彭博。所有价格与收益率仅为指示性报价,仅供参考。如需进一步信息,请联系大华继显产品团队。
我们还就上述债券雷达的部分债券提供定期更新。本月焦点债券为:
BABA 4.875% 2030年5月26日到期
发行主体简介
阿里巴巴集团控股有限公司(BABA/9988.HK)为中国规模最大电商平台、头部云服务商及全球全栈AI龙头,业务涵盖线上零售、云计算、AI自研技术、物流及金融服务。截至2026年9月3日,公司股权市值2,730亿美元,现金储备570亿美元。公司存量未偿债券268.8亿美元,平均期限10年,平均固定票息2.92%(彭博数据)。
投资逻辑
- 全栈AI龙头优势。阿里巴巴搭建起涵盖云服务、AI大模型、应用套件与自研定制芯片的完整AI生态。为巩固技术领先地位,公司计划未来三年投入人民币3,800亿元(560亿美元)资本开支,该规模位居中国前列,超过其过去十年资本开支总和,进一步夯实全栈竞争壁垒。请点击此处查看关于阿里巴巴全栈优势的详细分析。
- 高额资本开支构成主要信用担忧。和其他超大规模云厂商类似,大规模资本开支对阿里巴巴而言是一把双刃剑。2027财年一季度,公司资本开支同比激增75%至人民币677亿元,导致自由现金流为负人民币447亿元,上年同期自由现金流则为负人民币188亿元。
- 大额资本开支打开可观变现空间。乐观一面是,阿里巴巴人民币3,800亿元的三年AI资本开支计划已完成约一半投放。管理层测算当前AI算力投资回收期为三年;若产能利用率、自研芯片渗透率以及云业务利润率持续改善,则投资回收期有望进一步缩短。
- 核心风险集中于AI投资回报率(ROI)。主要风险场景为AI高资本开支持续时间超出预期,而变现效果不足,导致盈利持续承压、自由现金流维持负值。考虑到AI投入增加,大华继显近期将公司2027财年盈利预测下调6.6%。尽管如此,阿里巴巴目前财务基本面仍处于可控稳健区间(详见下文)。
财务亮点(2027财年第一季度)
- 经营现金流/利息费用:9.75倍。尽管资本开支处于高位,但强劲的利息保障倍数意味着公司偿债能力充裕。
- 自由现金流/总债务: 17.33%。自由现金流为负,反映阿里巴巴在AI及云基础设施方面投入巨额资本开支,对现金流形成明显消耗。自由现金流是需要持续跟踪的一项核心信用指标。
- 净债务/EBITDA:5.72倍。该指标显示杠杆水平偏高,主要反映当前处于投资周期扩张阶段。盈利持续增长以及资本开支变现是推动降杠杆的关键因素。
- 流动比率:1.36倍。流动资产明显高于短期负债,表明短期流动性扎实,营运资本缓冲充足。
- 投入资本回报率(ROIC):1.44%。当前低回报主要源于AI大规模前期投入;随着AI业务持续规模化扩张并贡献更高利润率,ROIC有望逐步改善。
宏观评论
我们持续跟踪以下美国经济数据,以评估美联储政策及利率展望,并从中选取我们认为与当前宏观环境最相关的指标进行重点解读。
通胀 | 消费 | 产出 | 劳动力市场 | GDP | 美联储 |
CPI与核心CPI | 消费者情绪指数 | 制造业PMI | 初请失业金人数 | GDP | FOMC会议 |
PPI与核心PPI | 消费信贷 | 服务业PMI | 职位空缺 | GDPNow (预计) | 美联储官员讲话 |
PCE与核心PCE | PCE消费 | 新订单 | 非农就业人数 |
| FedWatch |
| 零售销售 | 运价指数 | 失业率 |
| 预测市场 |
|
|
| 薪资增速 |
| FOMC会议 |
核心结论:从鸽派线索来看,美国消费显露疲态,部分制造业指标开始降温。从鹰派线索来看,最新就业数据韧性超预期,进一步支撑美联储的鹰派基调。9月11日即将发布的CPI数据将成华尔街研判后续利率路径的关键依据。
- 劳动力市场数据(8月非农就业)。8月非农新增就业16.2万人,几乎为5.6万人一致预期的三倍,失业率持平于4.1%。市场定价明显偏鹰:FedWatch显示9月加息概率自50%升至60%,黄金下跌1%,美元指数上涨0.2%,10年期美债收益率小幅上行4个基点。
资料来源:彭博、FedWatch
- 通胀(7月CPI与PCE)。7月通胀数据好坏参半,整体通胀放缓的背后暗藏底层粘性。整体CPI回落至3.4%,核心CPI同比降至2.5%,优于预期,暂时缓解市场加息担忧。生产端PPI明显降温至同比5.5%(6月6.6%),核心PPI小幅下行至3.6%。但美联储重点观测的核心PCE稳定在3.3%,略高于3.2%的一致预期,凸显去通胀“最后一公里”仍存在阻力。
- 产出(8月制造业/服务业指数)。8月ISM制造业指数下降1.0点至54.6,低于预期,新订单、产出及就业分项同步走弱。与此相反,ISM服务业指数逆势上行1.3点至55.4,新订单、商业活动与就业分项创下多年高位。制造业整体走弱、名义建筑支出下降0.5%,叠加标普全球服务业PMI下修,预示着2026年下半年工业增长面临下行压力。
- 消费(7月零售与8月消费者信心)。作为美国GDP增长核心引擎,美国消费显露疲态。整体及核心零售销售额环比分别下降0.6%及0.4%,为年内首次月度下滑,显著低于环比正增长的一致预期。尽管部分走弱可归因于日历扰动(亚马逊会员日),但财政刺激红利消退带来的结构性隐患更值得关注。例如,OBBBA带动退税(同比+17%)形成的消费提振已基本被消化,2026下半年消费上行空间有限。情绪层面,8月密歇根大学消费者信心指数再度回落至51.7,仅略高于50临界值,印证在持续通胀与高利率的双重担忧下,消费者信心依旧脆弱。
美联储vs财政部:殊途同“绳”
美国财长斯科特・贝森特与美联储主席凯文・沃什近期一系列举措与表态引发诸多争议、困惑乃至批评。仅简单预判市场波动率上行并不充分。我们将深入拆解波动的潜在驱动来源,协助投资者为后续市场环境做好应对准备。
- 两“醉汉”各行其道。毋庸置疑,财政部与美联储拥有完全不同的法定使命、政策理念与政策框架。尽管市场普遍将贝森特和沃什视为特朗普的经济幕僚,但二者运作相对独立,一方无法掌控另一方。这推翻了市场的一种主流假设:财政部与美联储将无条件执行特朗普的政策指令。
- 被沉重的绳索栓在一起。这种“独立性”存在前提约束:财政部与美联储虽在法律上相互分离,但政策走向会随宏观环境和政治压力出现冲突或协同。贝森特与沃什深知各自政策会互相扰动,因此必须审慎把握政策力度,妥善应对政策交叉冲击。这根结构性绳索一方面能使财政部与美联储的利益达成统一、提升政策传导效率,另一方面也容易催生矛盾,单边政策的实施效果因此大打折扣。
类别 | 财政部 | 美联储 |
当前理念 | 务实干预、供给端久期管理与经济民族主义 | 弱化前瞻指引(美联储信号)、坚持市场自律优先于政策干预,AI作为结构性生产力驱动因素(长期利好) |
法定权责 | 经济增长与财政偿付能力:债务管理、财政增收、维护金融稳定、提升美国竞争力 | 双重法定使命:物价稳定(通胀目标)与最大化可持续就业 |
目标变量 | 3‑3‑3战略目标:实际GDP增长3%、财政赤字占GDP比重降至3%、原油日产量增加300万桶。 | PCE通胀(~2%目标)、失业率处于可控区间。 |
主要工具 | 债务发行管理、外汇干预、国库一般账户(TGA)管理、税法执行、应急信贷机制、制裁(OFAC)等。 | 联邦基金利率(政策利率)、量化宽松/量化紧缩(QE/QT)、流动性工具(贴现窗口、常设回购工具SRF)、准备金相关调控利率(IORB/ON RRP)等。 |
- 当前阶段分歧大于协同。贝森特与沃什不仅底层政策理念存在差异,出台的举措还可能彼此抵消。举例而言,贝森特近期将长期国债回购规模扩大一倍,依靠增发短期国库券筹措资金;而沃什则在杰克逊霍尔会议释放明显鹰派信号,暗示可能很快加息抗击通胀。
- 短端确定性仍高于长端。尽管财政部与美联储存在政策摩擦,但现阶段短端流动性更佳、走势更可控。沃什计划缩减规模达7万亿美元的美联储资产负债表,或形成偏向短期国库券的结构性调整,有助于吸纳贝森特增加的短债供给。长端变量则更为错综复杂:美联储缩表、高油价、AI融资需求扩张、美国财政隐忧以及债券投资者的警惕情绪,都存在推高收益率的可能性,削弱贝森特债市干预策略的实际效果。
- 殊途同“绳”。让我们回到开篇的核心论点:财政部与美联储当前的政策航向出现分歧,但二者仍被一根双向约束的“绳索”拴在一起。归根结底,约束并统一双方利益的核心因素包括国内经济、市场稳定性以及政策公信力。因此,若后续形势向好,财政部与美联储有望进入政策完全协同的平稳阶段。在此窗口期到来之前,市场震荡仍将持续。
信用观点
美国信用债:AI融资重塑投资级债前景
美国信用债市场9月开局整体环境向好。企业盈利与资产负债表构成基本面支撑,违约风险可控,显著低于周期末期信用恶化时的水平。但当前信用利差接近历史低位,叠加高利率长期化环境,依靠利差进一步收窄增厚资本利得的空间有限,票息与收益仍将成为回报的主要驱动力。
AI投资周期仍是信用债市场重要的结构性变化。2026年美国投资级债券净发行规模接近1万亿美元,亚马逊、Alphabet、微软、Meta、甲骨文与SpaceX合计发债规模超2,000亿美元,募集资金用于AI投资。AI相关债券持续发行推高组合集中度并带来供给压力,投资者或将要求更高风险溢价,高频发债主体和长久期债券面临更大定价压力。
AI融资也在向美元市场之外扩散,Alphabet首次发行澳元袋鼠债为标志性事件。8月Alphabet募资55亿澳元(约39亿美元),创下澳元公司债发行规模历史新高。这笔分六档发行的高级无抵押债券包含3年期、5年期固定利率与浮动利率品种,以及10年期、20年期固定利率债券。最终定价:3年期债券在BBSW/互换利率基础上溢价65个基点,5年期溢价90个基点,10年期溢价133个基点,20年期溢价180个基点,固定票息区间5.20% 6.90%。市场认购需求旺盛,最终订单规模超180亿澳元,约为发行规模的3.3倍。本次发行反映出澳大利亚市场对稀缺高评级科技信用债存在旺盛需求,同时也证明云巨头有能力在非美元市场实现融资渠道多元化。
我们整体仍看好美国信用债,但判断信用利差进一步普遍收窄的空间有限。我们维持对短久期(<3年)、高评级投资级企业债的核心推荐。
亚洲信用债:AI融资格局分化,择券重要性抬升
亚洲信用债9月开局基本面整体稳健,但估值偏贵,难以承受利空冲击。8月下旬摩根大通亚洲信用指数(JACI)利差稳定在88bp左右,近期收益主要由美债收益率下行驱动,而非信用利差进一步收窄。我们判断票息收益仍是主要收益来源,不宜博弈利差大幅压缩。
中国科技板块成为亚洲投资级债内部分化的重要来源。预计至2030年,中国头部互联网企业AI及相关资本开支投入规模超3,250亿美元,巨额投资持续拖累自由现金流。阿里巴巴完成800亿港元配股,凸显融资压力,大规模AI投入叠加净现金储备下滑,对外融资依赖上升,其债券易受新增供给冲击。腾讯AI投资策略更为务实,经常性现金流充裕,游戏与广告收入多元化,基本面更占优,仅阶段性受到AI资本开支拖累。百度内生现金生成能力偏弱,但可借助银行信贷、租赁业务以及AI芯片子公司拓宽融资渠道。整体而言,中国科技板块并非全线走弱,而是信用资质显著分化,长久期债券存在估值重定价风险。
SK海力士诠释了AI信用叙事的另一面。阿里巴巴等云巨头持续投入AI基建,而SK海力士则直接受益于高带宽内存(HBM)、先进DRAM与企业级固态硬盘(SSD)等AI数据中心核心组件的需求增长。彭博行业研究预计,在强劲HBM需求与存储涨价的推动下,其2027年营业利润将较一致预期高出10-11%。盈利改善直接带动信用指标走强。继穆迪上调评级至A3后,标普8月将SK海力士评级由BBB+提升至A /展望正面。这与资本密集型云巨头面临的信用担忧形成明显反差。SK海力士案例的启示清晰:投资者应当区分两类企业,一类承担AI巨额资本投入,另一类则依托核心零部件供应兑现AI红利。
我们整体仍看好亚洲信用债,但建议提高择券标准。我们看好高评级亚洲投资级债券、中短久期票息资产、防御型金融债以及SK海力士等直接受益于AI资本扩张的发债主体。另一方面,我们对长久期中资云巨头债券(AI资本开支削弱自由现金流)、估值偏高的高级金融债,以及存在持续外部融资需求的发行主体保持谨慎。
亚太地区主要主权利率监测
Region | 2 Year | 5 Year | 10 Year | 30 Year |
Australia | 4.77 | 4.79 | 5.17 | 5.64 |
China | 1.21 | 1.39 | 1.68 | 2.16 |
China (usd) | NA | NA | NA | NA |
India | 6.24 | 6.45 | 6.96 | 7.54 |
Indonesia | 6.62 | 6.90 | 7.10 | 7.18 |
Indonesia (USD) | 4.23 | 5.10 | 5.71 | 6.03 |
Japan | 1.83 | 2.26 | 2.94 | 4.05 |
Malaysia | NA | 3.53 | 3.91 | 4.28 |
New Zealand | 3.58 | 4.18 | 4.76 | 5.42 |
Pakistan | NA | 11.76 | 12.12 | NA |
Philippines | 6.06 | 7.02 | NA | NA |
Philippines (USD) | 4.37 | 4.90 | 5.61 | NA |
Singapore | 1.68 | 2.01 | 2.36 | 2.44 |
South Korea | 3.66 | 4.10 | 4.35 | NA |
South Korea (USD) | 4.22 | 4.37 | NA | NA |
Taiwan | 1.67 | 1.82 | 1.85 | 2.09 |
Thailand | 1.15 | 1.60 | 2.19 | 3.18 |
资料来源:彭博,数据截至2026年9月3日
信用利差
信用债收益率
债券ETF与基金雷达
投资债券基金的主要风险
- 市场风险:利率上行、信用利差扩大、经济放缓或发行主体特定事件风险,均可能导致债券价格下跌。
- 货币风险:汇率波动可能显著影响回报。
o 美元走强可能提升以新加坡元计价的未对冲外币资产价值。
o 美元走弱可能抵消甚至逆转债券价格的涨幅。
- 对冲份额类别:许多基金提供新加坡元、欧元、澳元、港元或人民币对冲份额类别,以降低汇率波动,让投资者更聚焦于信用和久期敞口。
高收益敞口
- 全球债券基金通常可能同时持有投资级与高收益债券。
- 高收益债券伴随更高的违约风险、宏观风险及流动性风险。
- 这意味着更高的价格波动与潜在本金亏损,若持有未对冲敞口且对应币种贬值,相关风险将进一步放大。
关键考量
- 过往表现不代表未来回报。
- 收益率不应作为投资决策的唯一依据。
- 若希望顺应去美元化趋势、降低美元资产配置比例,对比:
o 对冲份额类别
o 对冲成本
o 整体风险–收益特征
债券ETF与基金雷达:核心要点
Name | Category | Duration Type | Expense | Effective Duration | Average Yield | Credit Quality |
Vanguard Short-Term Corporate Bond ETF (VCSH US) | Investment Grade ETF | Short | 0.03% | 2.7 | 5.00% | 54.79% in A rated and above 45.23% in BBB rated Average Quality – A- |
iShares Core U.S. Aggregate Bond ETF (AGG US) | Investment Grade ETF | Intermediate | 0.03% | 5.78 | 5.06% | 87.89% in A rated and above 11.56% in BBB rated Average Quality – AA |
iShares iBoxx $ Investment Grade Corporate Bond ETF (LQD US) | Investment Grade ETF | Long | 0.14% | 7.71 | 5.72% | 59.36% in A rated and above 39.87% in BBB rated Average Quality – A- |
HSBC Short Duration Bond Fund | Investment Grade UT | Short | 0.70% | 2.57 | 4.90% | 43.49% in A rated and above 44.75% in BBB rated 10.32% in HY Average Quality – A-/BBB+ |
PIMCO GIS Income Fund | Investment Grade UT | Intermediate | 1.45% | 6.73 | 7.32% | 80.60% in A rated and above 9.90% in BBB 9.20% in HY Average Quality – AA- |
Fidelity US Dollar Bond Fund | Investment Grade UT | Long | 1.03% | 6.6 | 5.03% | 81.18% in A rated and above 12.84% in BBB 2.33% in HY Average Quality – AA- |
资料来源:彭博、晨星、iShares和Vanguard,数据截至2026年9月3日。在美国上市的ETF可能使投资者收到的全部股息面临30%预扣税。更多详情请咨询税务顾问。
债券ETF与基金雷达(续):表现数据
Fund Name | ISIN / Ticker | Currency | 1 Month Total Return (%) | YTD Total | 1 Year Total Return (%) |
HSBC GIF Global Short Duration Bond Fund | LU1163226092 | USD | 0.03 | 1.48 | 3.06 |
LU1272399756 | SGD | -0.20 | -0.27 | 0.28 | |
LU2639850283 | EUR | -0.09 | 0.29 | 1.10 | |
PIMCO GIS Income Fund | IE00B7KFL990 | USD | -0.22 | -0.17 | 2.78 |
IE00B9HH6X13 | SGD | -0.38 | -1.87 | 0.04 | |
IE00B84J9L26 | EUR | -0.35 | -1.32 | 0.85 | |
Fidelity Funds - US Dollar Bond Fund | LU0261947682 | USD | -0.22 | -1.75 | -0.33 |
LU2605879787 | SGD | -0.47 | -3.46 | -3.11 | |
LU2730164063 | EUR | -0.34 | -2.93 | -2.29 | |
Vanguard Short-Term Corporate Bond ETF (VCSH US) | VCSH US | USD | 0.02 | 0.94 | 2.58 |
iShares Core U.S. Aggregate Bond ETF (AGG US) | AGG US | USD | -0.09 | -0.41 | 1.56 |
iShares iBoxx $ Investment Grade Corporate Bond ETF (LQD US) | LQD US | USD | -0.30 | -1.39 | 0.55 |
Bloomberg US Aggregate Total Return Index | LBUSTRUU Index | USD | -0.04 | -0.49 | 1.60 |
资料来源:彭博,数据截至2026年9月3日。单位信托采用累计份额类别(不派发基金现金股息),ETF采用股息再投资口径计算收益。
术语表
平均票面利率(Average Coupon):债券组合中各类债券票面利率的加权平均值。
平均信用质量(Average Credit Quality):债券组合中各债券信用评级的加权平均值(参见“平均评级”定义)。
平均久期(Average Duration):债券组合价值对利率变动的敏感度。久期越长,利率敏感性越高。
平均评级(Average Rating):债券组合中所有债券评级的加权平均值。例如,某组合25%为AAA级、25%为 BBB级、50%为CCC级,则加权平均信用评级为B+(介于BBB级与CCC级之间)。
平均到期收益率(Average Yield To Maturity):使债券组合未来所有现金流现值等于当前组合价格所要求的回报率。
最差收益率(Yield To Worst, YTW):债券在完全遵守合约条款且不违约的情况下,可能实现的最低收益率。基于最早赎回或清偿日期计算(假设发行人行使赎回权提前偿还本金)。
有效久期(Effective Duration):同“平均久期”。
有效到期日(Effective Maturity):对于含赎回、回售或提前偿付条款的债券,用于替代其最终到期日的计算日期。
当期收益率(Running Yield):票面利率除以债券组合市价所得的收益率。与到期收益率不同,当期收益率不考虑债券市价与到期赎回价的差异。
Disclosures and disclaimers
This report is provided subject to, and must be read together with, the full Disclosures / Disclaimers available at this link, which are incorporated by reference into this report. In particular, this report is intended for general circulation and informational purposes only and does not constitute personal investment advice or a recommendation to buy or sell any investment product or security. You should independently evaluate the information and, where necessary, seek advice from a qualified financial adviser regarding the suitability of any investment. Analyst certifications required under applicable regulations, including SEC Regulation AC (where relevant), are included in this report. By accessing, receiving or using this report, you acknowledge that you have read, understood and agreed to be bound by the Disclosures / Disclaimers, as may be amended, supplemented or updated from time to time.


