

CIO Summary
- AI fundamentals remain strong, as evidenced by both hard industry data and the latest company earnings. July’s violent rotation out of semiconductors and other AI-related stocks was mainly driven by deleveraging, high market expectations and negative investor narratives.
- Macro headwinds vs. AI tailwinds. Persistent macro uncertainties, including geopolitical risks, elevated oil prices, higher bond yields and the Fed wildcard have amplified AI sector volatility and contributed to the rotation. Macro risks could gradually gain the upper hand, leading to a potential market awakening likely around September-October.
- Join our CIO Series events in August to navigate this complex and challenging environment, with curated insights and expert opinions. Details inside.
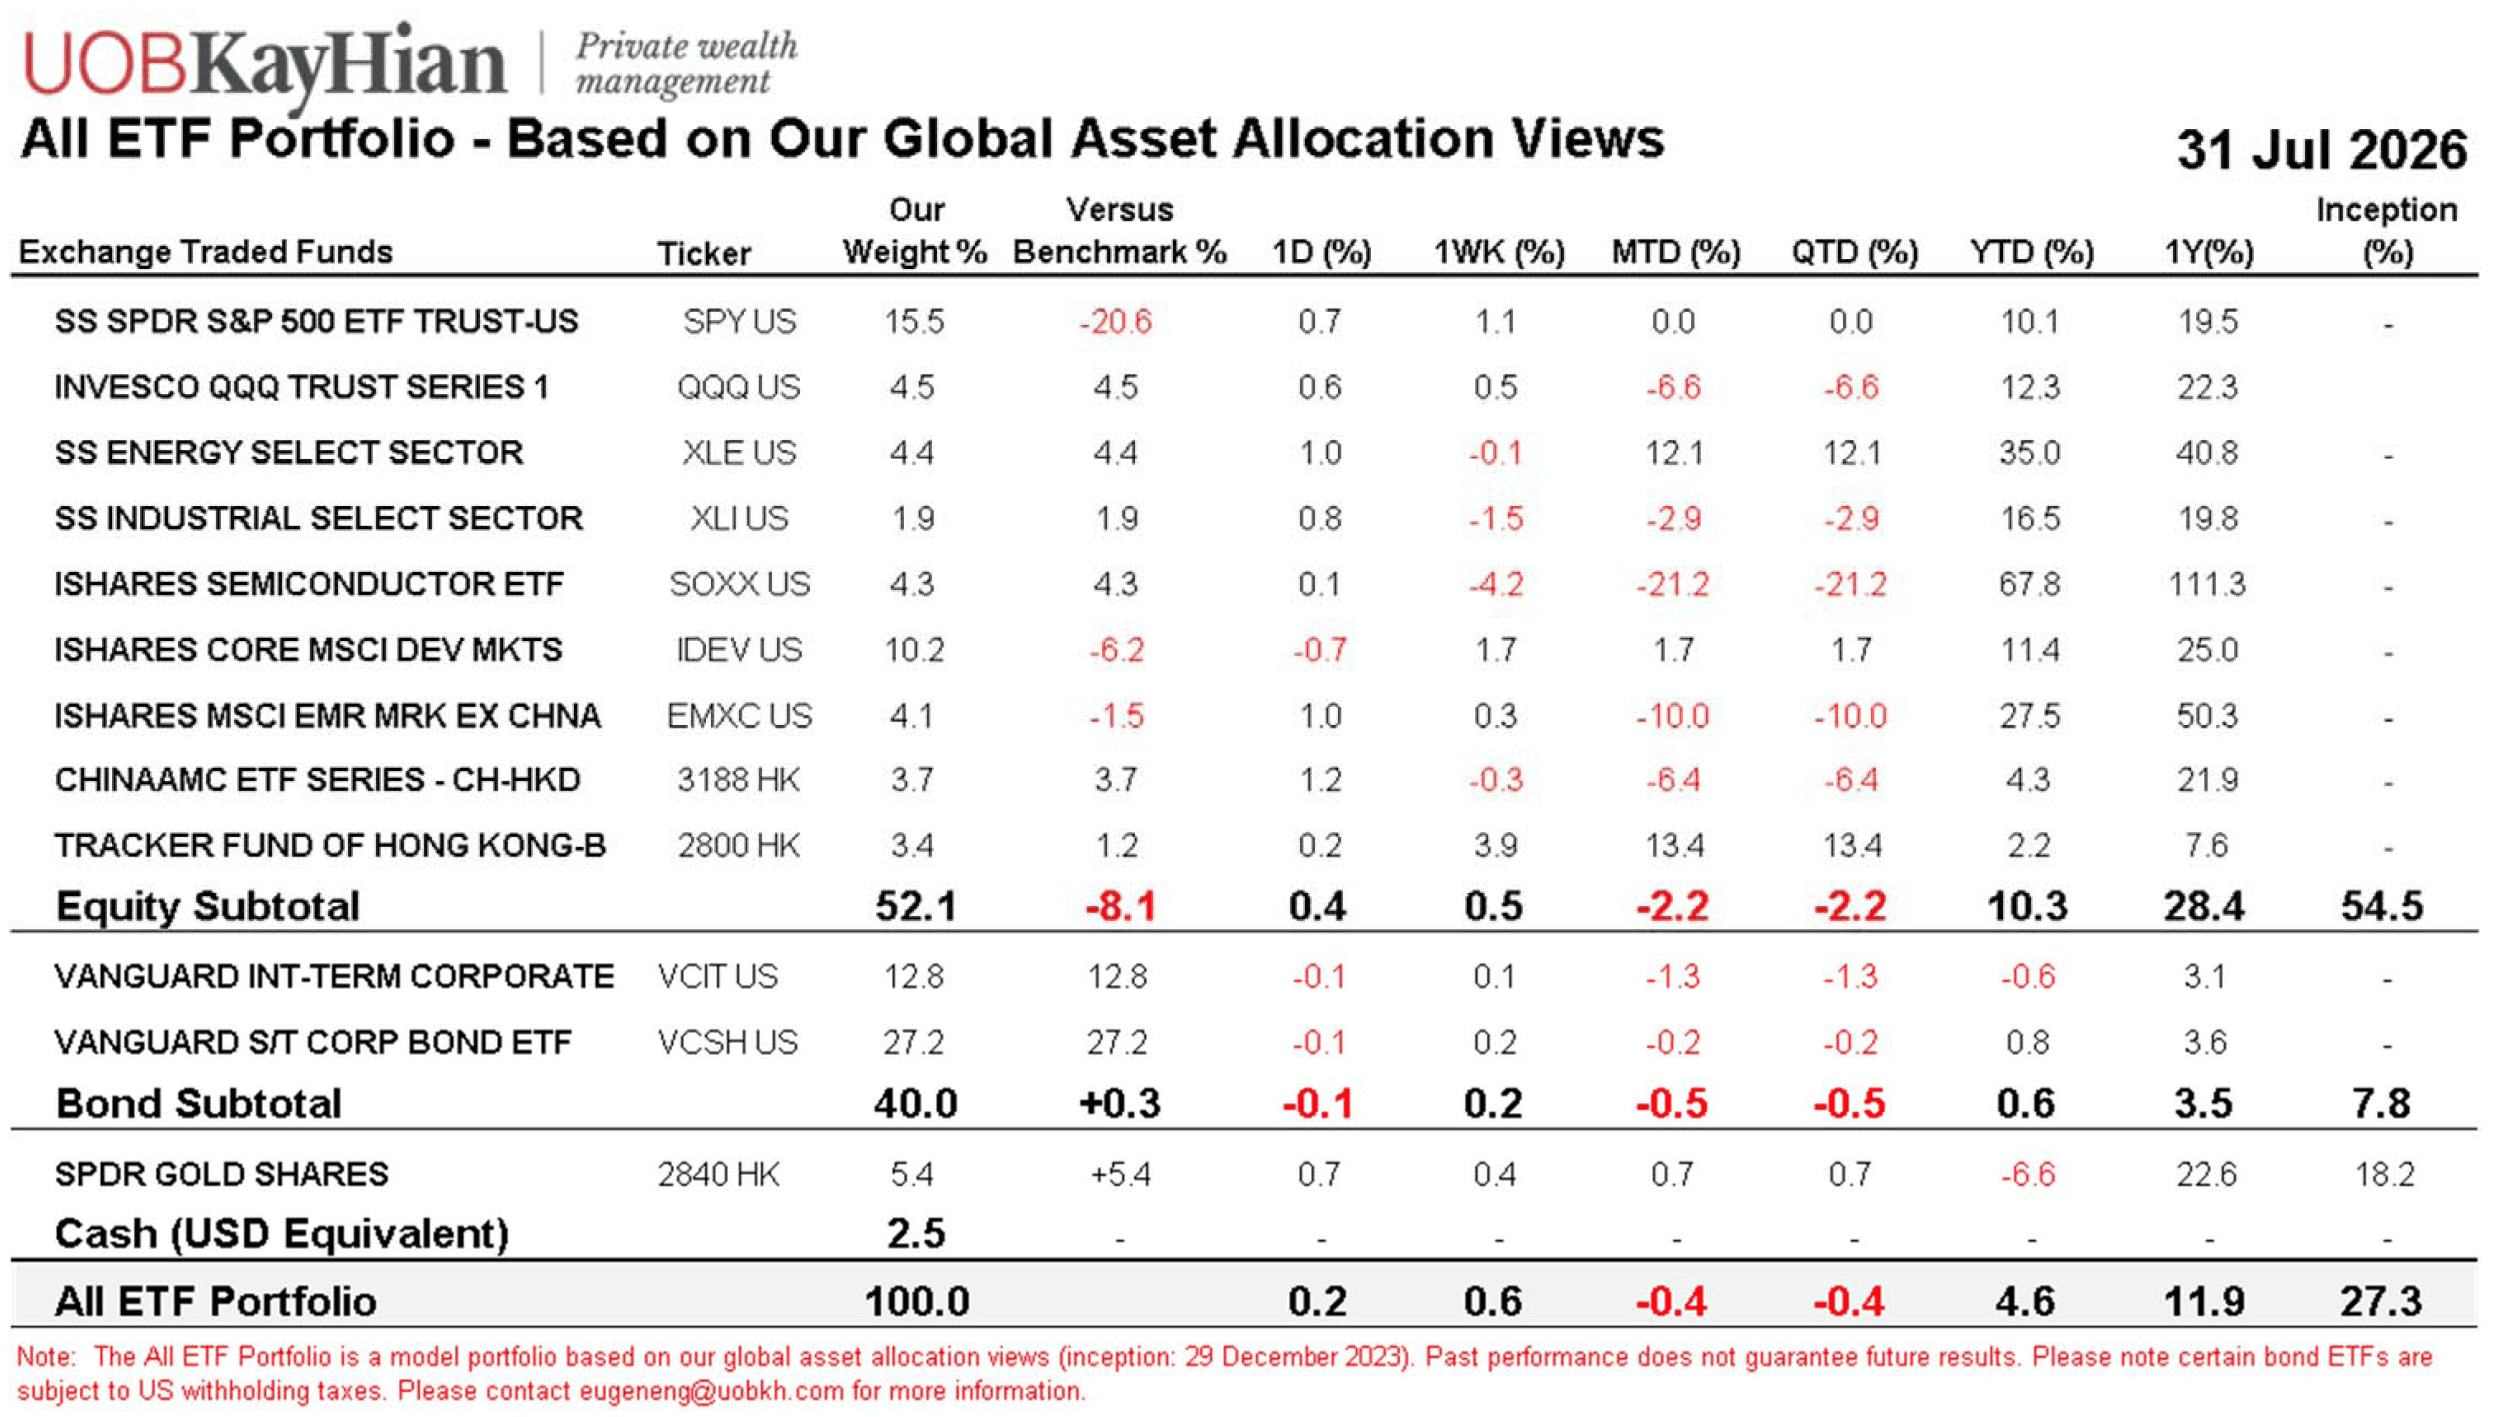
- Our All ETF Model Portfolio for global asset allocation was down 0.4% in July but still up 4.6% YTD. The Hang Seng Index ETF (2800.HK) and the Energy Sector ETF (XLE) were the largest contributors, while the Semiconductor ETF (SOXX) and Emerging Markets ex. China (IEMX) were the biggest detractors.
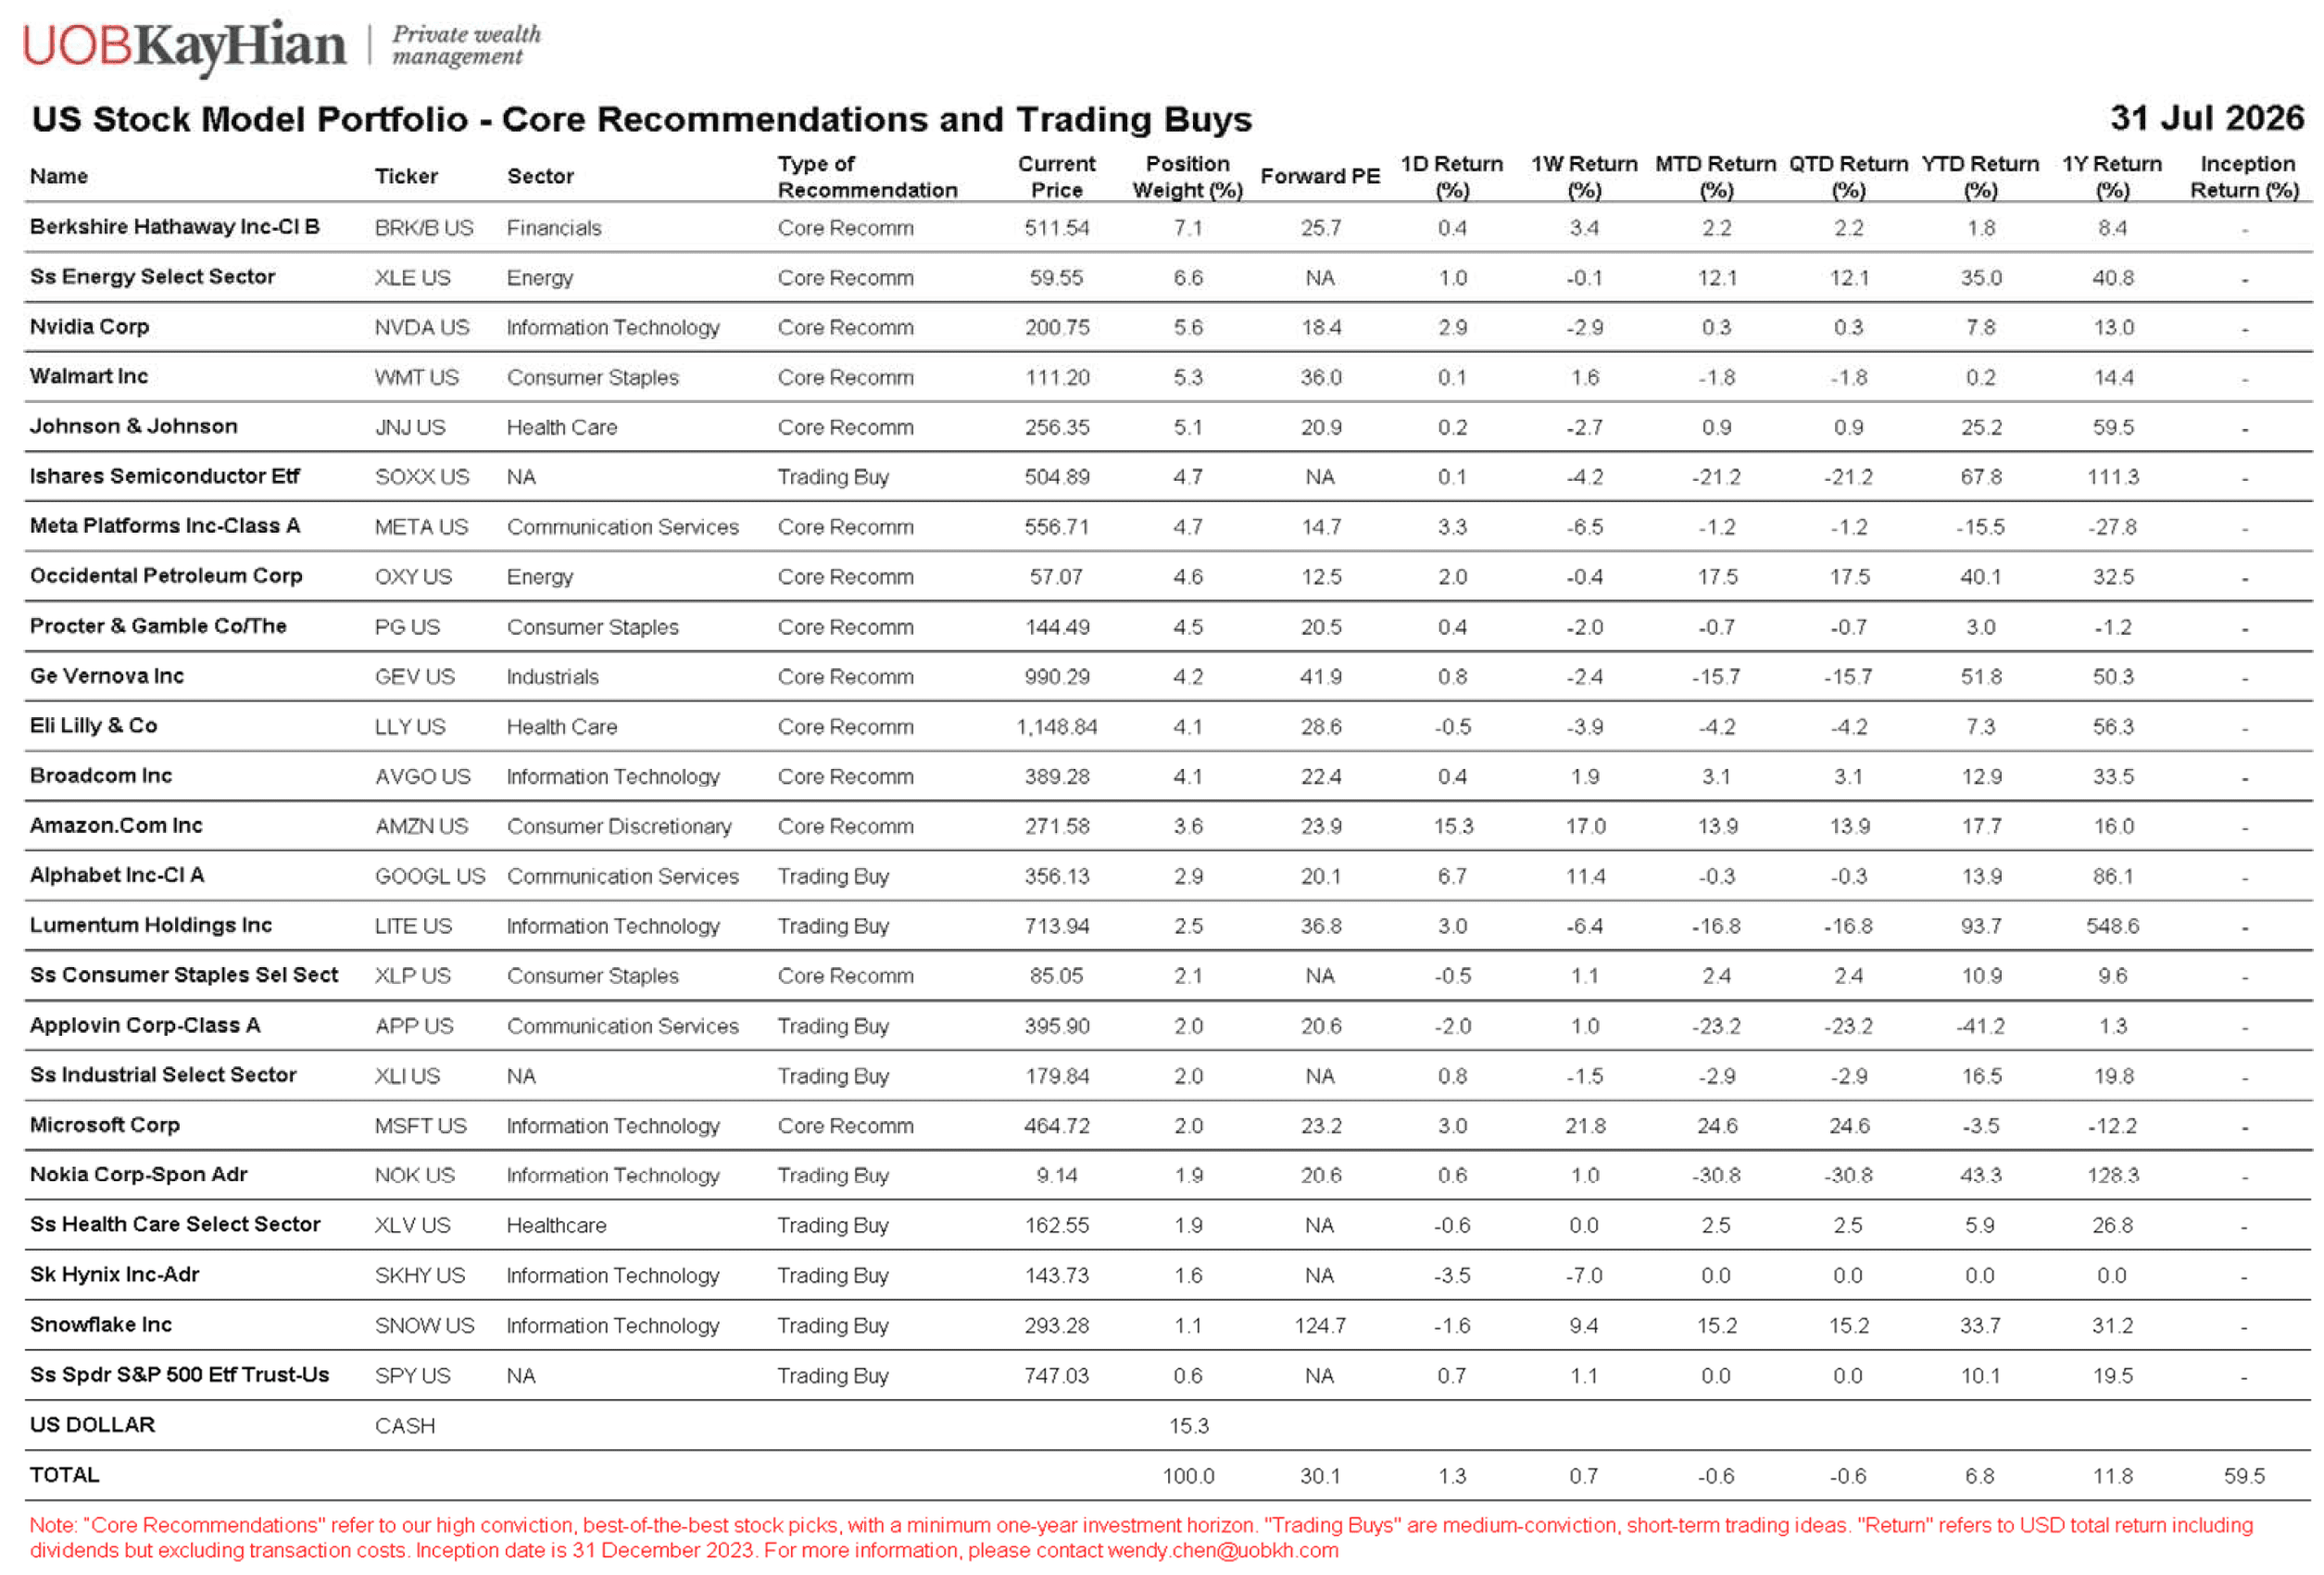
- Our US Stock Model Portfolio lost 0.6% in July but still gained 6.8% YTD. Top 3 performers: MSFT +24.6%, OXY +17.5% and SNOW +15.2%.
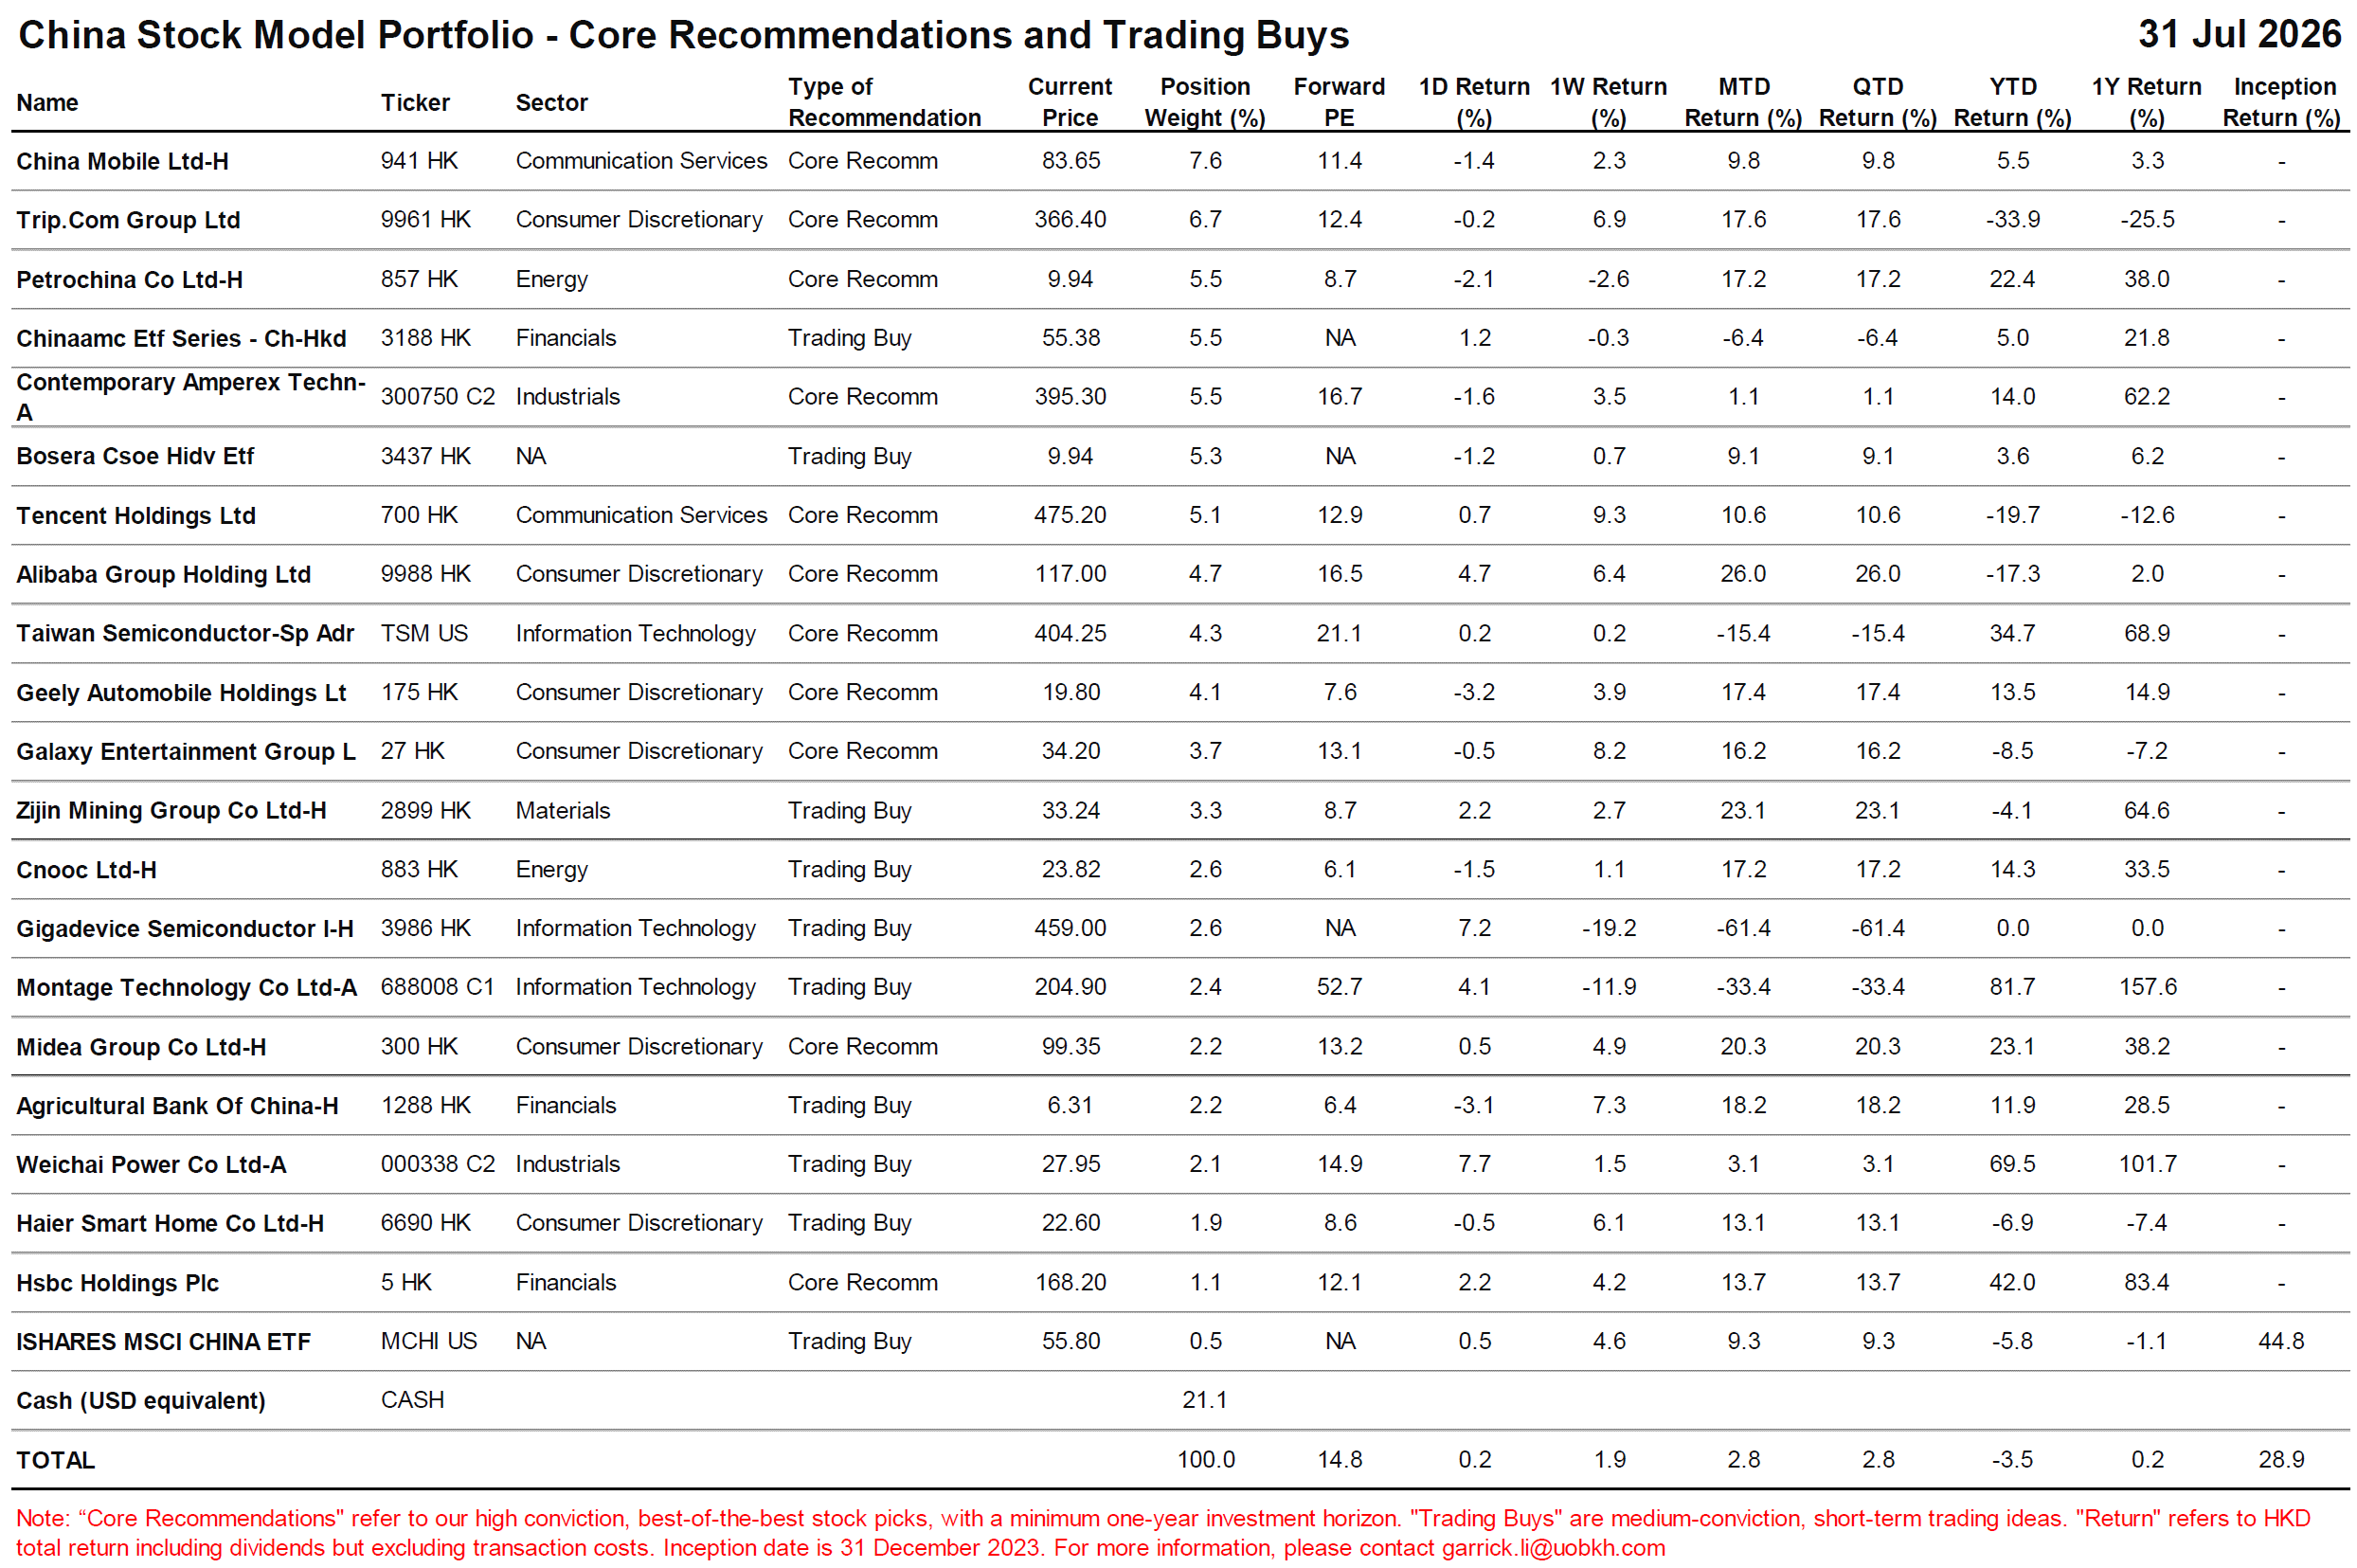
- Our China Stock Model Portfolio gained 2.8% in July yet remained down 3.5% YTD. Top 3 performers: 9988.HK +26.0%, 2899.HK +23.1% and 0300.HK +20.3%.
- Fixed income strategy: maintain our Core Recommendation on high-quality, investment-grade bonds with short durations (< 3 years).
- Commodities: Continued central bank buying provides long-term support, reinforcing gold (2840.HK or GLD) as a top beneficiary of de-dollarisation.
Core Views and Recommendations
Asset Class | Core Views | Core Recommendations |
Equities | We remain cautious on global equities given the confluence of tariffs, geopolitical risk and extreme market concentration (related to AI). The Iran oil shock adds another layer of macro uncertainty by further lifting inflation, dampening growth and raising policy challenges. | Underweight equities in global asset allocation. See our All ETF Model Portfolio below. |
US Equities | We are cautious on US equities for the same reasons above (including the “Fed Wildcard”), compounded by valuation concerns. Within US equities, we maintain high conviction in AI’s long-term growth potential, despite concerns over macro uncertainty and concentration risk. We also favour well-managed, “true defensive” companies, which continue to demonstrate stability and resilience in an uncertain macro environment. We continue to like energy – both as a hedge against geopolitical risks and a key beneficiary of surging AI electricity demand. | Underweight US equities in global asset allocation (All ETF Model Portfolio) AI: AMZN, AVGO, META, MSFT, NVDA Defensives: BRK/B, JNJ, PG, WMT, XLP Energy: OXY, XLE, GEV Others: LLY See our US Stock Model Portfolio below. |
China Equities | We are cautious on China due to continuing macro weakness (“China’s Growing Pains”), characterized by a subdued real estate market and sluggish domestic demand, coupled with external shocks and a lack of stimulus. Having said that, the Iran oil crisis may be a blessing in disguise for China, as it could amplify Beijing’s manufacturing edge and supply chain dominance, thus benefiting industrial production and exports. Within China equities, we also favour AI, defensives and energy. | Overweight China equities in global asset allocation (All ETF Model Portfolio) AI: 0700.HK, 9988.HK, TSM Defensives: 0941.HK, 0005.HK, 0300.HK Energy: 0857.HK, 300750.SZ / 3750.HK Others: 0027.HK, 0175.HK, 9961.HK See our China Stock Model Portfolio below. |
Fixed Income | Bonds remain an essential asset class in a multi-asset portfolio, offering stable income, capital preservation, and diversification. Current bond yields also remain attractive relative to long-term inflation expectations. However, the US fiscal imbalance and the related de-dollarisation trend could be potential game changers for fixed-income investing. In addition, both the Fed policy and the new Fed chair are wildcards, adding to market uncertainty in 2026. | Overweight bonds in global asset allocation (All ETF Model Portfolio). We have changed our Core Recommendation from intermediate-term (5-7 years) IG bonds to short-duration (<3 years) bonds. Build a currency-diversified fixed income portfolio, incorporating local currency and FX hedged bonds or bond funds. See Appendix E for UOB’s currency views. |
Commodities | We expect de-dollarisation to continue in 2026 and beyond with gold as a top beneficiary of this long-term trend. | Overweight gold in global asset allocation (All ETF Model Portfolio). |
CIO Commentary
Rotation defined global markets more than just volatility in July. This was evident across asset classes, regions, equities, and even within the AI sector. Such dynamics suggest that:
- Risk appetite for equities remains intact, despite ongoing geopolitical uncertainty, macro headwinds, the Fed Wildcard and AI concentration risk. However, we continue to believe investors may be too complacent about Fed rate hikes and global tightening risk. September-October remains a potential window for a major market awakening, where volatility could exceed prior levels.
- Rotations suggest investors may be conflicted with recurring macro headwinds (top-down) and continuing strong AI fundamentals (bottom-up). You can hardly blame them for the frequent shifts in positioning. After all, the world is becoming increasingly difficult to decipher. For one thing, AI is no longer just a Silicon Valley innovation, but a disruptive force that could fundamentally change geopolitics, economic structure, fixed income, equities and even Fed policies.
As a firm that is “Serious about investing”, UOB Kay Hian is dedicated to helping you navigate this complex and challenging environment, so that you can act with clarity and conviction. Please continue to follow our research and join our CIO-led events, where we bring together curated insights, actionable ideas and a trusted network of investment specialists.
Below are our CIO Series events this month, featuring leading third-party experts. We hope you can join us.
Date & Time | Event | Guest Speaker | Location | Language | Registration |
7:30PM | 对话CIO系列私享会 #11: 韩国豪赌欧亚算力,中美 AI 竞赛正酣 | 江经宇, | Online | Chinese | https://voovmeeting.com/dw/sRpVvYXw7IHv? https://meeting.tencent.com/dw/sRpVvYXw7IHv? |
6:30PM 18 Aug | CIO Series #38: Asia's AI Moment - What Investors Need to Know | Dan Kiang, Founder and CIO of Aqua Lake Capital | Online | English |
|
12:00PM 21 Aug | CIO Series Luncheon: US Market Outlook | Phil Mackintosh Chief Economist Nasdaq | Hong Kong | English | RSVP Iris Lee (iris.lee@uobkh.com) |
5:30PM | CIO Series Forum: Macro Shocks vs AI Tailwinds | Phil Mackintosh Chief Economist Nasdaq | Singapore | English |
Asset Allocation (All ETF Model Portfolio)
Source: UOB Kay Hian and Bloomberg. As of July 31, 2026.
- Our All ETF Portfolio for global asset allocation was down 0.4% in July yet still up 4.6% YTD. The Hang Seng Index ETF (2800.HK) and Energy Sector ETF (XLE) were the largest contributors, up 13.4% and 12.1% respectively. Meanwhile, Semiconductor ETF (SOXX US) and Emerging Markets ex-China ETF (IEMX) were the biggest detractors, down 21.2% and 10.0% respectively.
- US equity UNDERWEIGHT (30.6% vs. 36.1%). We do not intend to increase US equity exposure until the Fed’s first rate hike, which the market expects in September but we still anchor to December. In the meantime, there remain ample trading opportunities from sector rotation. In July, we took profits in the Energy Sector ETF (XLE) after a brief oil spike and also trimmed the Industrial Sector ETF (XLI). Proceeds were redeployed into Nasdaq-100 (QQQ) and the Semiconductor Sector ETF (SOXX) during the recent pullback, as we believe the sharp correction offers an attractive buying opportunity.
- Developed Markets ex-US UNDERWEIGHT (10.2% vs. 16.4%). DM ex-US (IDEV) gained 1.7% in July, driven by strength in European equities yet dragged by Japan amid the sell-off in AI and semiconductors. Despite the ups and downs, IDEV remained up 11.4% YTD.
- Emerging Markets ex-China UNDERWEIGHT (4.1% vs. 5.6%). EM ex-China (EMXC) declined 10% in July after a sharp sell-off in Korea (also AI-related) but remained up 27.5% YTD.
- China equity OVERWEIGHT (7.1% vs. 2.2%). We took profits in the Hang Seng Index ETF (2800.HK) after its strong rally and after the index hitting our preset target in July.
- Fixed income EQUAL-WEIGHT (40.0% vs. 39.7%). Fixed income held steady amid equity market volatility, down just 0.5% in July vs. a 2.2% decline in global equities. The intermediate term corporate bond ETF (VCIT) fell 1.3% in July and remained down 0.6% YTD, while the short-term corporate bond ETF (VCSH) slipped only 0.2% in July and remained up 0.8% YTD. This has confirmed that our Core Recommendation to stay short-duration is working.
Gold OVERWEIGHT (5.4% vs. 0.0%). The Gold ETF (2840 HK) gained 0.7% in July yet remained down 6.6% YTD. We continue to view gold as a portfolio diversifier and a long-term hedge against geopolitical risk, currency volatility and the de-dollarisation trend.
Equities
US Equities
July was a month of extreme volatility, which isn’t obvious as the S&P 500 was down only 0.1% last month. Beneath the calm surface, the Nasdaq fell 3.2% while SOXX collapsed 21.2%, driven by a cascade of macro uncertainties, stretched expectations, bearish narratives, deleveraging squeezes and retail sentiment swings. Our US Strategist Wendy Chen was spot-on with her call on this rotation. Access the replay of our joint-CIO Series webinar if interested.
- Narrative-driven panic over AI. The market panic was triggered by a series of negative narratives on AI: (1) News of Meta's plan to lease out compute was misread as a signal of compute oversupply and impending capex cuts; (2) the release of Chinese open-source model Kimi K3 sparked fears of a price war with existing frontier models (Anthropic, OpenAI); (3) Chinese DUV lithography progress triggered a semiconductor equipment sell-off and concerns that US AI firms may be losing ground across the entire stack. Last but not least, macro events such as renewed Middle East tensions, a resurgence in oil prices, rising bond yields and the Fed Wildcard also amplified the sell-off.
- AI fundamentals remain intact. Despite a long list of worries, data points have yet to point to a meaningful deterioration in AI fundamentals. GPU rental prices continued to surge 50%-60% over the past seven months, while Meta, Google and Amazon all raised full-year capex guidance during 2Q results – among other supportive evidence.
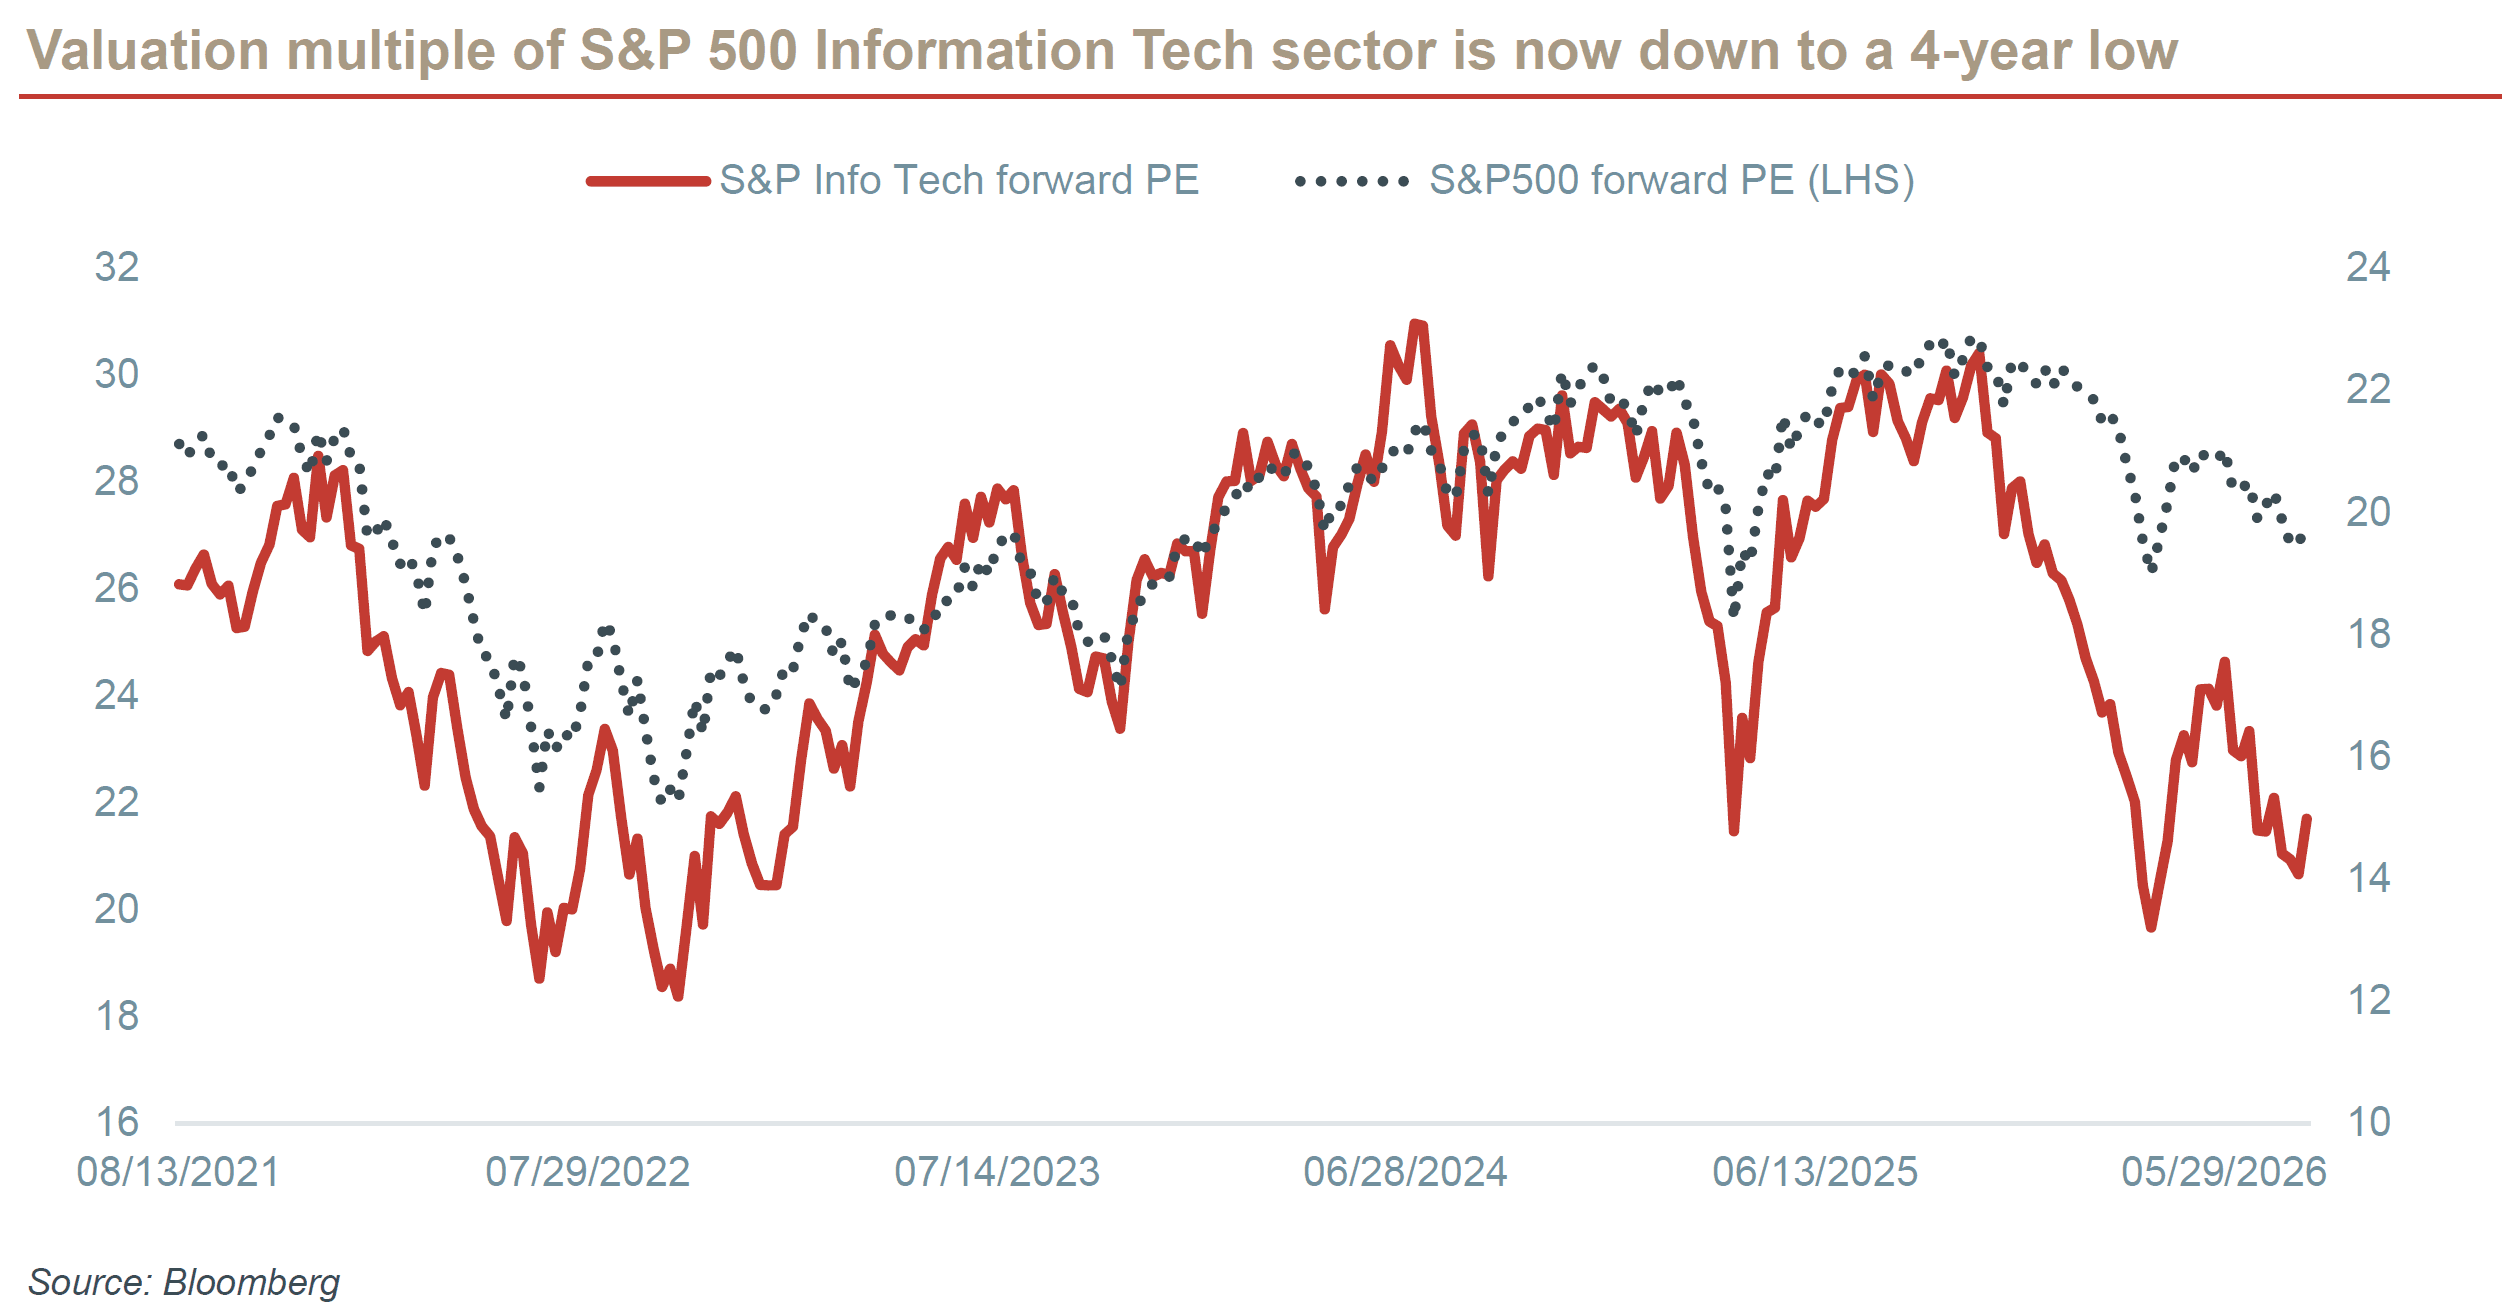
- Broad earnings fundamentals remain intact. Beyond just AI, the broader earnings backdrop remains remarkably robust: 86% of S&P 500 companies that have reported 2Q earnings so far beat estimates, with a staggering 47% yoy increase in EPS – up from the 27% growth in 1Q. As a result, Wall Street has lifted full year earnings growth estimates for the S&P 500 and Nasdaq to 29.3% and 46.1%, respectively. For AI hardware stocks, higher earnings estimates but lower stock prices mean a significant PE compression, with the forward PE of S&P 500 Info Tech sector now down to a 4-year low (see chart below).
- Potential credit market headwinds. While AI and tech equity risks are mainly illusory, the credit market could face real AI-related headwinds, with hyperscaler CDS spreads skyrocketing and potential spillovers to other markets. Refer to our Fixed Income section below for more information.
- Short-term outlook constructive. The late-July collapse of a once-USD 45bn AI fund triggered the second-largest de-grossing of the past decade – which has now concluded. Aggressive deleveraging and systemic cleansing of levered positions appear to be ending. We foresee a cleaner technical tape ahead, allowing investors to refocus on AI fundamentals. S&P 500 has been following our playbook of "range-bound with an upward bias" in the short-term. Our view is unchanged.
- Medium-term caution warranted. Beyond September and into 4Q, however, we advise investors to be wary of a potential market awakening, as the rate hike risk and midterm election uncertainty may begin to price in more aggressively.
Source: UOB Kay Hian and Bloomberg. As of July 31, 2026.
- Our US Stock Model Portfolio lost 0.6% in July yet remained up 6.8% YTD, underperforming S&P 500 (SPY) – which was flat in July and up 10.1% YTD. The July lag was driven by Industrials (GEV -15.7%), Technology (NOK -30.8%, LITE -16.8%, SOXX -21.2%) and Communication Services (APP -23.2%), partly offset by gains in Energy (OXY +17.5%, XLE +12.1%), Consumer Discretionary (AMZN +13.9%) and Software (MSFT +24.6%).
- Cash remained largely unchanged at 15.3% at July-end, reflecting our portfolio rotation strategy, with purchases funded by sales. We added to JNJ, PG, WMT, XLV, NVDA, META and SOXX, with money from exiting MU and QCOM, as well as trimming AVGO, LITE, MSFT, AMZN, SKHY, XLE and OXY.
- Top 3 performers: MSFT +24.6%, OXY +17.5% and SNOW +15.2%.
- Bottom 3 performers: NOK -30.8%, APP -23.2% and SOXX -21.2%.
- Alphabet (GOOGL) reported strong 2Q results. Revenue grew 24% yoy to USD 119.8bn, slightly ahead of expectations, while EPS of USD 2.85 came in slightly below consensus. Advertising revenue remained resilient, and Google cloud surged 82% to USD 24.8bn, exceeding elevated buyside expectations of 70%+ growth. The company's order backlog increased by 11.7% qoq to USD 514bn, highlighting sustained demand visibility. Bearish arguments focus on the company’s first-ever negative free cash flow (FCF) and cloud margin possibly peaking. However, we remain constructive on GOOGL, as its robust backlog reaffirms continuing strong AI demand.
- Amazon (AMZN) reported a strong 2Q with revenue rising 20% yoy to USD 201bn, 2% ahead of consensus. EBIT reached USD 27.5bn, comfortably beating the USD 26bn consensus. AWS was the standout driver, with revenue surging 37% versus already elevated buy-side expectation of 35% growth. Backlog also increased 36% qoq to USD 496bn. Management raised FY2026 capex guidance to USD 220bn (from USD 200bn) primarily due to higher memory-related costs. Management also offered crucial insights into AI data center economics, stating that servers have a 5-to-6-year useful life, AI capacity is contracted for five years, and capital investments will reach breakeven under three years (implying a 30%+ IRR). This narrative immediately boosted investor sentiment on hyperscaler stocks, leading to a 15% surge in AMZN shares in a single day. We maintain our positive view on Amazon, supported by its leadership in cloud computing and now the compelling return on AI investments. The stock currently trades at 21x forward PE, with earnings expected to grow 14.8% in 2026E and 13.2% in 2027E.
- Nokia (NOK) reported a beat-and-raise for 2Q. Revenue grew 9% yoy to EUR 4.82bn, and comparable operating profit rose 18% to EUR 434mn (beating the EUR 382mn estimate). Net sales to AI and cloud clients more than doubled, while new order booking reached EUR 2.8bn – highlighting robust AI networking demand. The company said the backlog offers solid revenue visibility well into late 2027 and 2028 – a positive surprise. We believe Nokia will continue to capture massive AI infrastructure growth, by leveraging decades of carrier-grade IP and optical networking expertise.
- Microsoft (MSFT) reported a solid earnings beat. Azure grew 43%, exceeding the +40% expectation, with management guiding for further acceleration. Copilot was another bright spot, with users reaching 30m versus the 25m expectation, and penetration remaining low at 5%. The results offered further validation for Microsoft’s AI-driven cloud business model, supporting the case for increasing its capex.
- Meta (META) reported largely in-line results. 2Q revenue grew 28% yoy to USD 60.8bn – slightly above the 60.2bn consensus. However, the midpoint of its 3Q revenue guidance came in below consensus. Despite strong advertising growth, investors are increasingly demanding clarity on how Meta’s AI capex will translate into tangible monetization beyond ads. We agree that Meta’s AI endeavors lack further visibility in the near term, but its core advertising business continues to deliver impressive growth. AI monetization is still very early for Meta – patience is recommended.
- SK Hynix (SKHY) reported a 2Q earnings miss, with revenue of KRW 79.32tr (USD 56.4bn, +51% qoq), below the KRW 84tr expectation. Operating profit reached KRW 60.54tr (USD 43bn), also below the consensus of ~KRW 63tr. The miss was primarily attributable to a higher mix of HBMs with fixed prices under Long-Term Agreements (LTAs), which are below current market prices. It seems Hynix tries to prioritize revenue visibility over profit maximization – a prudent strategy given the volatile environment. During the call, management also confirmed that it’s reviewing several options – including special dividends, dividend increases, and share buybacks and cancellations – to enhance shareholder returns. This represents another shareholder-friendly initiative that should support the stock's long-term performance, in our view.
- AppLovin (APP) reported a 2Q earnings miss, with revenue and earnings both up 53%+ yoy but still 5% below consensus. Management attributed the weakness to product timing, as the updated recommendation engine was only launched at quarter-end – a one-time issue. However, its advertisement targeting performance is also slowing down – which is worth noting. Without ad tech advancement and significantly wallet share gains, our APP investment thesis could be weakened. We are still evaluating whether such mis-executions are inherent to APP’s cutting-edge technologies or indicative of deeper issues within the company. Our Trading Buy rating is currently under review.
- Johnson & Johnson (JNJ) reported a solid beat-and-raise, with organic sales growing 5.7% yoy while adjusted EPS rising 4.7% yoy – both beating estimates by 1%. Pharma was the standout driver, delivering 6.9% organic growth despite a 760-bps Stelara headwind, fueled by a 71% surge in TREMFYA and rapid ramp-ups of INLEXZO and ICOTYDE. MedTech sales grew 3.7% yoy, with Orthopedics, Surgery and Vision all posted earnings beats. Management remained highly confident in underlying MedTech procedure trends, seeing no slowdown on regulatory impact, while expecting acceleration across all four MedTech segments in 2H2026. Additional positive developments recently:
o Significant pipeline expansion through acquisition. JNJ completed a USD 1bn acquisition of Firefly Bio to strengthen next-generation antibody engineering for tumors, and committed USD 785mn upfront for Sail Biomedicines to expand its autoimmune pipeline.
o Legal overhang reduction. JNJ announced an estimated USD 5.5bn settlement covering ~76,000 ovarian cancer-related talc claims, which, subject to approval, would resolve most outstanding lawsuits and improve visibility over future liabilities.
JNJ remains our Core Recommendation and one of our "True Defensive" holdings. The stock currently trades at 21x forward PE with revenue/earnings expected to grow 7%/10% in both FY2026 and FY2027.
- Eli Lilly (LLY) reported another beat-and-raise, with revenue of USD 23bn (+48% yoy, 12% ahead of consensus), and EPS of USD 8.40 (+33% yoy, well above consensus). Eli Lilly’s flagship weight-loss and diabetes drugs (GLP-1 related), Mounjaro and Zepbound, generated a massive USD 15bn in combined sales, cementing the company's dominant global position. The newly launched oral weight-loss drug, Foundayo, is also capturing a meaningful portion of new prescriptions ahead of a broader global expansion. We reiterate our Core Recommendation on Eli Lilly on (1) its undisputed leadership in the GLP-1 market, (2) ongoing market share expansion outside US esp. China, Mexico, and Europe, and (3) robust non-GLP pipeline to provide next leg of growth, all reinforced by its status as an "AI Pharma Powerhouse". Current valuation remains attractive, as the stock trades at 28x forward PE – the low end of its 28x-45x historic range, with stellar earnings growth of 49% in FY2026 and 28% in FY2027 (expected).
- P&G (PG) reported mixed 4QFY2026 results, with flat organic sales – 1% below consensus. Core EPS fell 3% yoy to USD 1.43 but still 1% above consensus. Full-year FY2026 net sales rose 3% to USD 87.0bn, while organic sales grew a modest 1%. In 4Q, Beauty was the only division to deliver organic sales growth (+4% yoy on volume gains), offsetting a 2% decline in Baby, Feminine & Family Care category. Upstream inflation since the Iran conflict still pressured its margin as 4Q core operating margin contracted 1.3 ppt to 19.5%. Looking ahead, FY2027 guidance points to subdued growth of +1-3% in organic sales and +0-3% for core EPS – weighed down by input costs, FX, and restructuring. On the bright side, management noted early signs of market share recovery in China (first share growth in 15 quarters). The stock currently trades at 21x forward PE with GAAP earnings expected to grow 5% in FY2027. We believe PG’s relatively high valuation is fully justified by its “True Defensive” nature, stable earnings and a long track record of paying dividends consistently.
- Occidental (OXY) reported a strong 2Q2026 beat, with adjusted EPS of USD 2.40 versus USD 1.84 expected – its highest quarterly profit since 3Q2022. Realized oil prices rose more than 50% yoy to USD 96.78/bbl, while production increased 2.4% to 1.43mn boepd, partly offset by a 12% decline in international output amid Middle East disruptions. Management lowered FY2026 capex guidance to USD 5.5–5.9bn from USD 6.3–6.7bn and tightened production guidance to 1.42–1.45mn boepd. The midpoint of its 3Q guidance of 1.40–1.44mn boepd implies a modest sequential decline. OXY currently trades at 9.6x 2026E PE and 14.8x 2027E PE, with estimated FCF yields of 9.95% and 6.99%, respectively. While its 2027E cash flow is expected to normalize, the near-term FCF yield remains attractive and provides meaningful capacity for further deleveraging and enhancing shareholder returns – which is a core pillar of our investment thesis.
- Must watch events in August: US Jul Labor data (Aug 7), US Jul CPI (Aug 12), US Jul PPI (Aug 13), FOMC Minutes (Aug 20), US 2Q GDP 2nd estimate & Jul PCE (Aug 26), Jackson Hole Symposium (Aug 27-29). Earnings: LLY, APP & OXY (Aug 5), BRK/B (Aug 8), LITE (Aug 11), WMT (Aug 20), NVDA (Aug 26). For more information, please see Appendix B.
China Equities
The Hang Seng Index surged 13% and MSCI China gained 9% in July, as investor sentiment on China improved temporarily. Overall, this still seems a relief rally, given that macro fundamentals remain weak (China’s Growing Pains) and new stimulus measures are still under discussion.
- China’s Growing Pains deepened in 2Q2026. GDP growth slowed to +4.3% yoy in 2Q, missing the +4.5% consensus and below the 5% recorded in 1Q. This marked the lowest growth rate since covid (4Q2022). Retail sales rose just 0.2% in 2Q, also the slowest pace since covid. Investments weakened sharply, declining 11% in 2Q compared to a 5.7% drop in 1H. Exports remained the only bright spot, +20% in 2Q and contributing to around 20% of GDP growth.
- “Stimulus” limited to capital markets and high-tech. July’s Politburo meeting did not deliver any new stimulus, and the market reaction was muted given low expectations. Worth noting, however, is the high-profile return of China’s “National Team” (state-backed financial institutions) as a buyer of domestic equities (A-shares). These entities together bought RMB 60bn (~USD 8.9bn) of equities in a single week in July, including RMB 50bn via China Reform and RMB 10bn via China Chengtong. Significance:
o With a struggling real estate market and weakening domestic demand, one would expect China to prioritize support for the real economy (rather than capital markets). This is a bit surprising.
o This is not a conventional stimulus, yet it shows the government’s focus may be shifting towards capital market intervention – which was rarely used as a stand-alone tool. It raises the intriguing possibility that China would adopt something similar to Japan's QE (as part of Abenomics). Note Japan's QE playbook has in part led to a decade-long bull market in Japanese equities.
o The National Team normally buy SOEs and large cap stocks only. However, the latest round of buying has broadened to private, high-tech firms, i.e. the STAR 50 ETF (588000.SH). This reinforces China’s overwhelming focus on technological self-sufficiency and innovation-led growth. Tech is unlikely to rescue the Chinese economy in the near term, yet it carries significant strategic importance for China, especially under our theme of the US-China AI Race.
Source: UOB Kay Hian and Bloomberg. As of July 31, 2026.
- Our China Stock Model Portfolio gained 2.8% in July, underperforming the MSCI China ETF (MCHI). The portfolio was down 3.5% YTD, outperforming MCHI’s 5.8% decline.
- Cash dropped to 21.1% at July-end from 23.0% in June, reflecting net buying during the month. We fully exited Xiaomi (1810.HK), bought Midea (0300.HK) and ABC (1288.HK) as new positions, added to Trip.com (9961.HK) and GigaDevice (3986.HK), and trimmed Tencent (0700.HK).
- Top 3 performers: 9988.HK +26.0%, 2899.HK +23.1% and 0300.HK +20.3%.
- Bottom 3 performers: 3986.HK -61.4%, 688008.SH -33.4% and TSM -15.4%.
- HSBC (0005.HK) delivered a modest operating beat in 2Q2026, with revenue excluding notable items of USD 19.1bn (+8% yoy), underlying PBT of USD 10.3bn (+13%) and Banking NII of USD 11.6bn (+9%), ahead of consensus by around 2%, 5% and 1%, respectively. The quality of the beat was supported by a 21% yoy increase in Wealth income and an improvement in CoR to 41 bps. However, the USD 1bn buyback was below its historical quarterly range of USD 2-3bn, despite CET1 of 14.1% (within the target range of 14-14.5%). Banking NII guidance was raised to “at least USD 46bn”, while the medium-term RoTE target was unchanged. We retain HSBC as a Core Recommendation for its resilient Banking NII, strong Asian wealth momentum and sustainable RoTE of at least 17%. However, its current valuation (3.6% dividend yield) does not seem very attractive.
- CATL (300750.SZ, 3750.HK) reported strong yet in-line 1H2026 results, with revenue up 54.8% yoy to RMB 276.9bn and attributable net profit up 42.0% to RMB 43.3bn. Robust battery shipments, management's strong demand outlook for 2H2026 and 2027, and continued expansion in energy storage and overseas markets remain key growth engines. Raw-material inflation and product mix may pressure unit profitability, but scale and global expansion should support longer-term earnings resilience. We maintain CATL as a Core Recommendation for its technology leadership, dominant market position and diversified growth across power batteries, energy storage and overseas markets. Its proposed RMB 20-40bn A-share buyback should act as a stock catalyst.
- Midea (000333.SZ, 0300.HK) recently replaced Haier as our new Core Recommendation. Both companies pass our ROIC-based True Defensive Screen, but Midea offers faster revenue growth, structurally higher margins and steadier ROICs, supported by more diversified growth drivers beyond just home appliances. In 2025, Midea’s overseas sales reached RMB 195.9bn, +15.9% yoy, while commercial and industrial solutions generated RMB 122.8bn, +17.5% yoy. Near-term domestic pressure should ease in 2H2026, while overseas orders have risen around 20% since April as PortaSplit gains strong traction in Europe. Midea's stronger net cash position, global OBM upgrade opportunity, and expanding KUKA (robotics), building-technology and new-energy businesses underpin a higher-quality and more resilient growth model than Haier.
- Haier Smart Home (600690.SH / 6690.HK) was downgraded from Core Recommendation to Trading Buy, not because of any negative change in fundamentals but reflecting our clear preference for Midea (see above). Haier remains a solid global appliance company, supported by strong brands, meaningful overseas scale, recent operating momentum, a lower valuation and a higher dividend yield (than Midea). However, its revenue growth is slower and margins remain structurally below Midea's, while the expected profit recovery depends on successful European restructuring, tighter domestic expense discipline and stronger North American operations.
- Both Midea and Haier fit squarely within our core China themes this year: China Export Shock 2.0 and China Maxxing, with a series of thought-leadership pieces already published. Please visit our research website or contact your UOB Kay Hian representative for more information.
- Must watch events in August: Geely Jul Monthly Sales (Aug 2), China Jul Exports (Aug 7), Montage IPO lockup expiry (Aug 8), China Jul CPI / PPI (Aug 9), TSMC Jul Monthly Sales (Aug 10), China Jul M2 Money Supply, New Yuan Loans, Outstanding Loan Growth and Total Social Financing (Aug 13), China 2Q GDP, Jul House Price Index, Retail Sales, Industrial Production, Fixed Asset Investment (YTD), Unemployment Rate (Aug 17), China Jul Industrial Profits (Aug 27), China Jul NBS PMI & China’s Top 100 Developer Real Estate Sales (Aug 31). Earnings: HSBC (Aug 4), Tencent & Galaxy (Aug 12), China Mobile (Aug 13), Weichai Power & PetroChina (Aug 14) est, Geely (Aug 17), GigaDevice (Aug 18), Zijin (Aug 21), CNOOC (Aug 27) est, Trip.com & Innovent (Aug 27) est, Alibaba & Haier (Aug 28) est, Montage (Aug 31) est. For more information, please see Appendix B.
Fixed Income
Below is the CIO Summary from our latest Fixed Income Monthly (Aug 6, 2026), for Professional / Accredited Investors only. Ping benjamintan@uobkh.com if you’d like to receive the full report.
- Short-term: everyone has a view, no one knows for sure. Fed Chair Kevin Warsh's intentional ambiguity in rate decisions will keep markets guessing - and swinging sharply between our "false hawkishness" and "false dovishness". Our own educated guess still points to a first rate hike in December, while acknowledging the extreme uncertainty ahead.
- Longer-term: beyond just rates. The real game-changer lies in Warsh's structural reform agenda, signified by his recent launch of five task forces to overhaul the Fed policy framework. This could deliver tangible results as early as the end of 2026.
- AI's broadening market impact. The narrative on AI's impact on fixed income is rapidly evolving from corporate credit into a paradigm shift at the macro level. The AI Credit Supercycle is now exerting upward pressure on the entire yield curve.
- It may all work out in the end. We see an emerging risk of a self-reinforcing vicious cycle, where heavy AI-related debt issuance widens spreads, raises borrowing costs, and forces even more debt issuance. However, this risk could be mitigated by Fed Chair Warsh's belief in AI's positive macro potential - provided that AI ultimately delivers the impact that he expects.
- Core Recommendation: remains on high-quality, investment-grade (IG) bonds with short durations (< 3 years).
Commodities
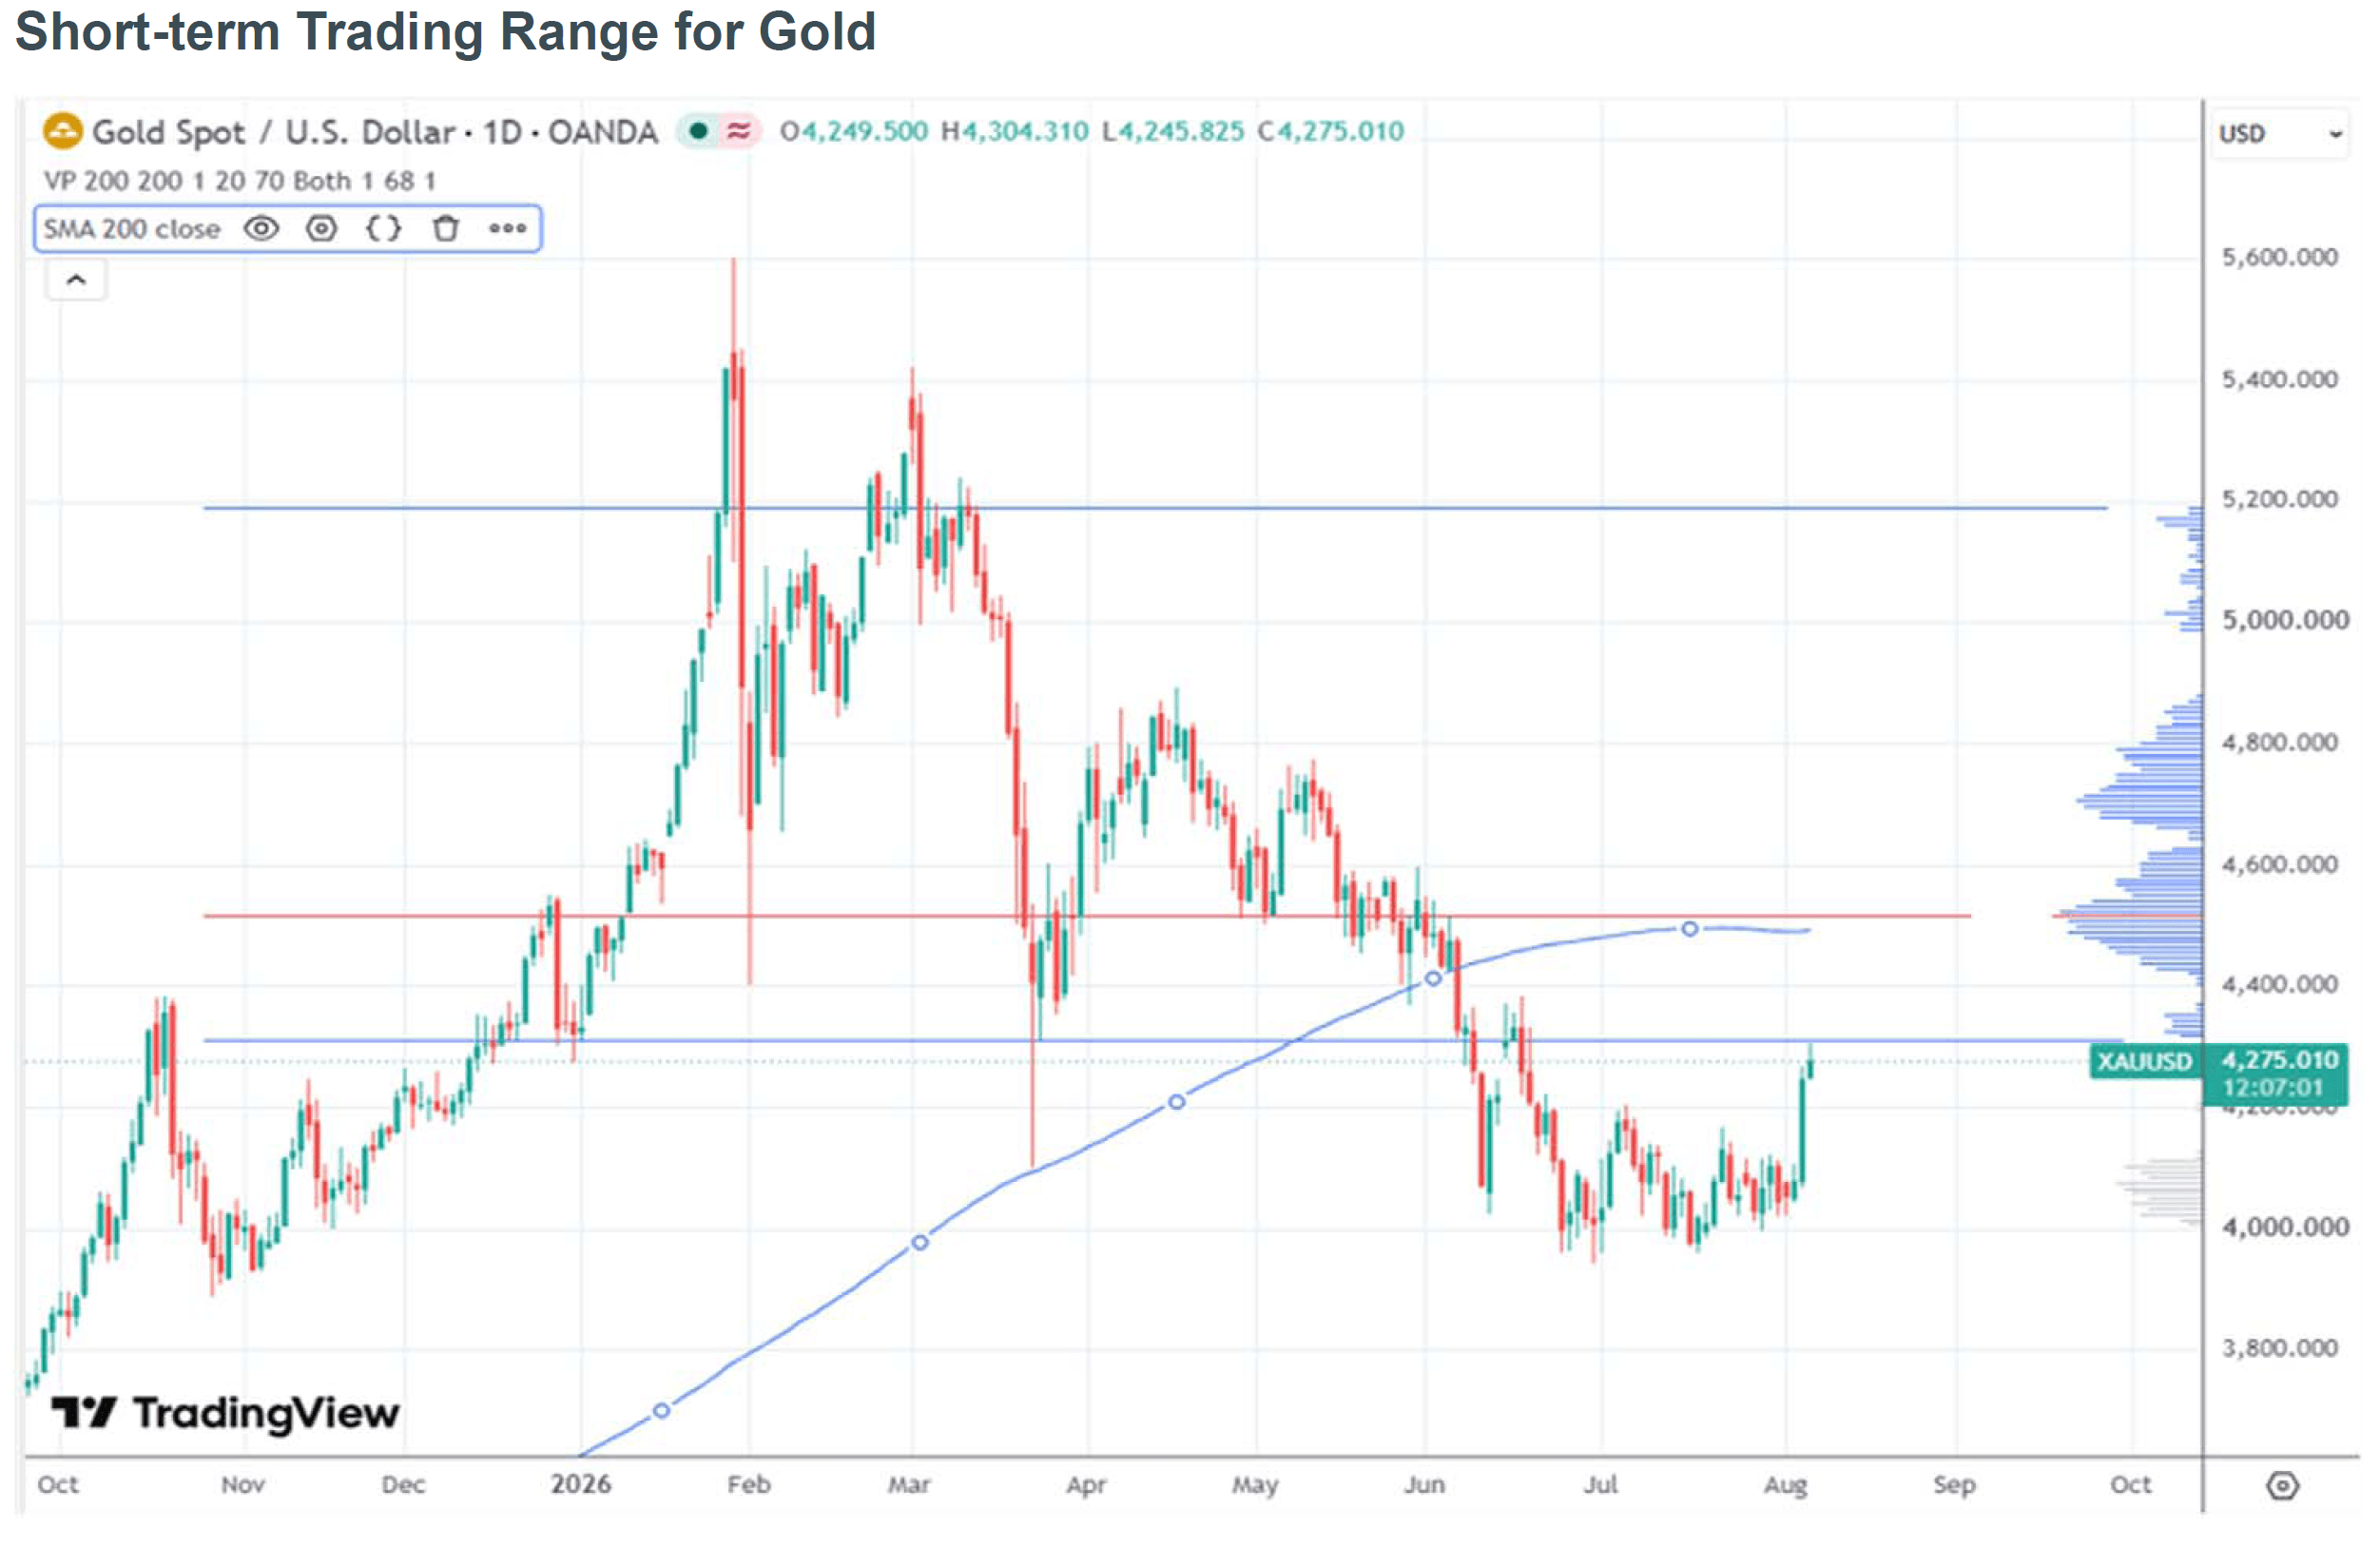
- Gold breaks higher despite elevated real yields. Gold broke out of its one-month consolidation range on August 5, closing at USD 4,246.82/oz. The technical bias has turned positive, with potential near-term upside at USD 4,393/oz and USD 4,511/oz. On the downside, USD 4,200/oz is the first near-term support and USD 4,000/oz remains a crucial support level.
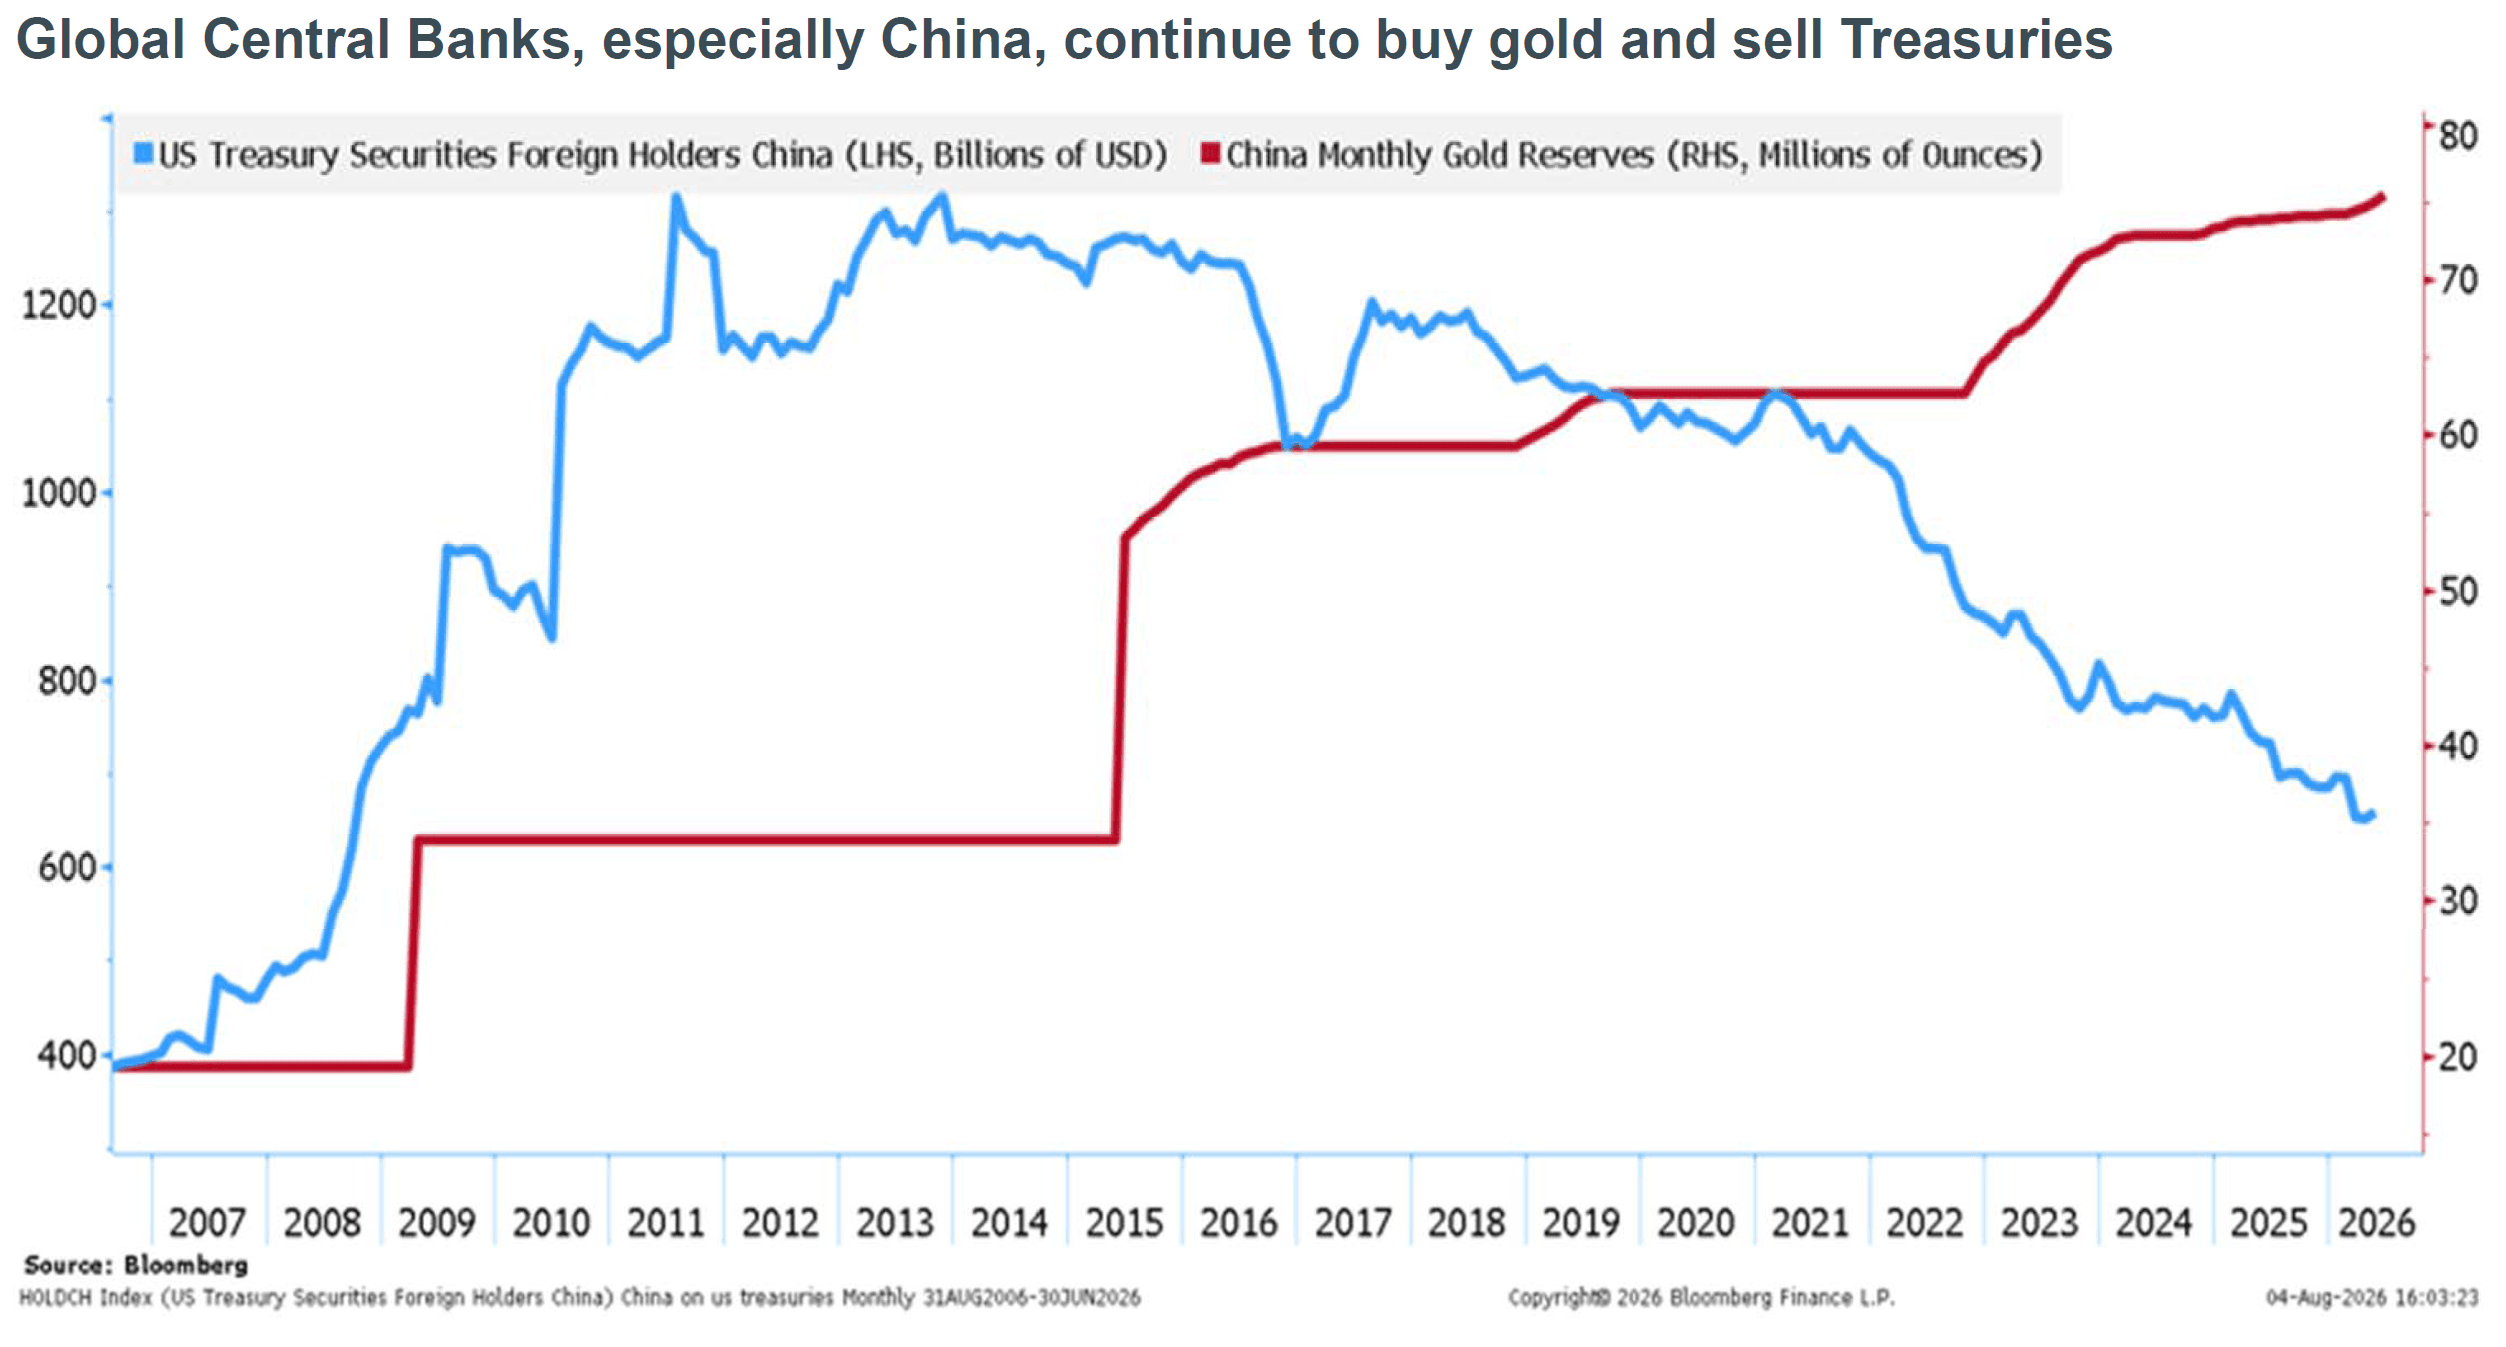
- Central-bank demand provides fundamental, longer-term support for gold. Purchases rebounded to 289 tonnes in 2Q2026 from a revised 57 tonnes in 1Q2026, taking 1H2026 buying to about 346 tonnes. The World Gold Council’s June survey showed that 89% of central banks expect global gold reserves to increase over the next 12 months and a record 45% of them plan to raise holdings. China’s steady accumulation of gold alongside a longer-term decline in its US Treasury holdings also reinforce gold as a top beneficiary of De-dollarising. (See chart below)
- Investors seeking exposure to gold can consider Gold ETF (2840.HK) or SPDR Gold Shares (GLD) for physical bullion exposure – both of which are our Core Recommendations.
Short-term Trading Range for Gold
Currencies
We rely on our associate UOB for currency views. Below are the latest insights from its Monthly FX Rates Strategy (August 4, 2026). Please refer to Appendix E for UOB’s official forecasts on FX, interest rates and commodities. You can also access the full selection of UOB research on its research portal.
Major FX & Rates Strategy: Warsh uncertainty pushes US Treasuries Yields even higher
- By now it has become abundantly clear that Fed Chairman Kevin Warsh is not a fan of forward guidance. Will Warsh be able to convince investors to embrace his leaner style of communication and much reduced forward guidance?
- However, the concurrent further rise in longer dated US Treasuries yield coupled with renewed USD weakness is a classic sign of increasing investors distrust in the Fed’s monetary policy. The recent inability of the USD to benefit from the higher US Treasuries yields is yet another sign of increasing worries about Fed credibility.
- The disconnect between geopolitical escalation and FX market response over the past month is worth noting. Despite the ceasefire collapse and a near-USD 30/bbl surge in Brent, the USD failed to attract meaningful safe-haven demand. This contrasts with the early stages of the US-Iran conflict in Mar, when geopolitical risk premia provided a clear and durable USD tailwind. In its place, monetary policy differentials have re-emerged as the primary driver of USD direction in 2H26 — consistent with our existing FX framework.
- We keep to our medium-term bearish USD bias. This is anchored on our expectation of an extended Fed rate pause through the remainder of 2026, with easing resuming across 2027 as the transitory component of inflation fades. The resulting compression in US rate differentials will be the dominant medium-term force against the USD. The DXY is expected to hold firm relative to G-10 peers through 3Q26 before resuming a gradual weakening trend thereafter to 96.9 in 2Q27.
- A compression of the US rate advantage remains the primary catalyst for a resumption of regional portfolio inflows and Asia FX appreciation from 4Q26. But ceasefire collapse, Brent's brief breach of USD 100/bbl, and the hawkish dissent at the Jul FOMC have collectively weakened, but not derailed, this base case. The primary upside risk to the USD — and downside risk to Asia FX — remains a scenario in which the Fed follows through on the hike path currently priced by swap markets.
- SGD's resilience is now underpinned by both a more hawkish MAS and a stronger growth trajectory — a combination that distinguishes it from most regional peers facing the dual headwind of oil-driven inflation and slowing activity. We therefore expect more SGD strength to 1.25 against the USD in 2Q27.
- In line with our macroeconomics team view of Fed easing across 2027, we see 3M compounded-in-arrears SOFR easing further to 3.47% in 2Q27. But in the back end, we see additional upside risks to UST yields, especially from increased fiscal supply and an unclear Fed commitment to bringing inflation down, as such 10Y UST yield may stay elevated at 4.8% in 2Q27.
We reiterate our view of a stable but gradually rising SORA and project 3M compounded-in-arrears SORA at 1.62% in 2Q27. In fact, we have observed firmer loan growth, thereby increasing demand for funding and contributing to upside pressure on SORA. Similarly, 10Y SGS yield is expected to climb further to 2.75% in 2Q27.
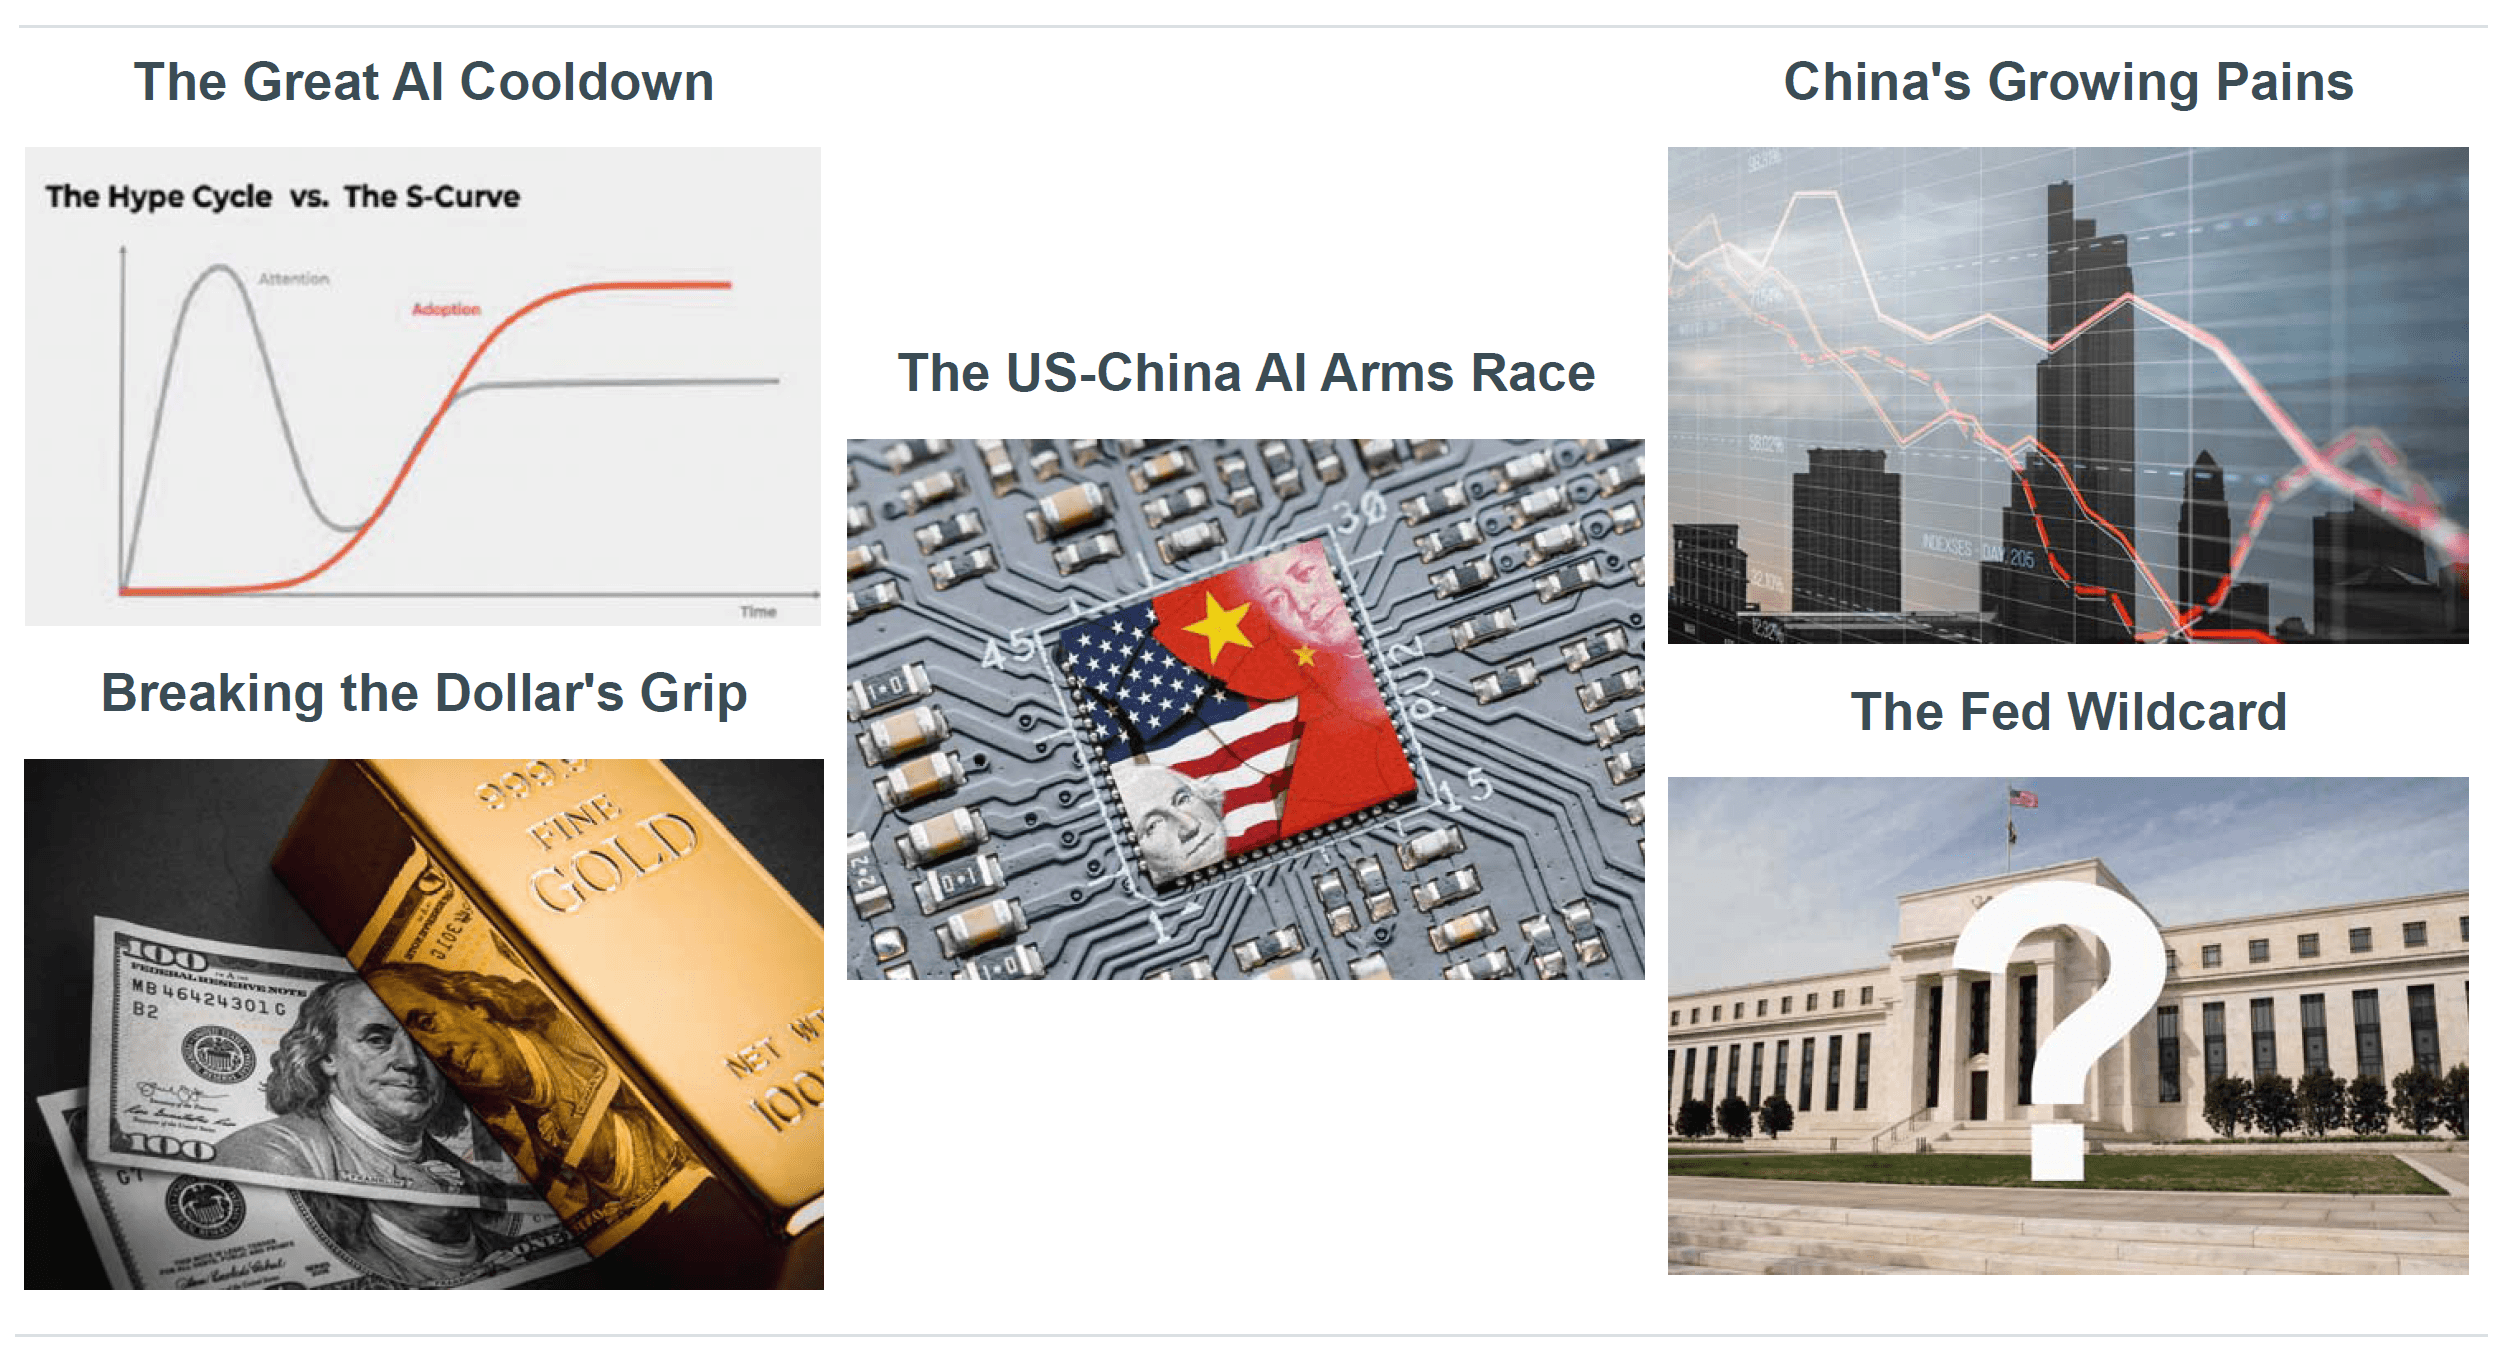
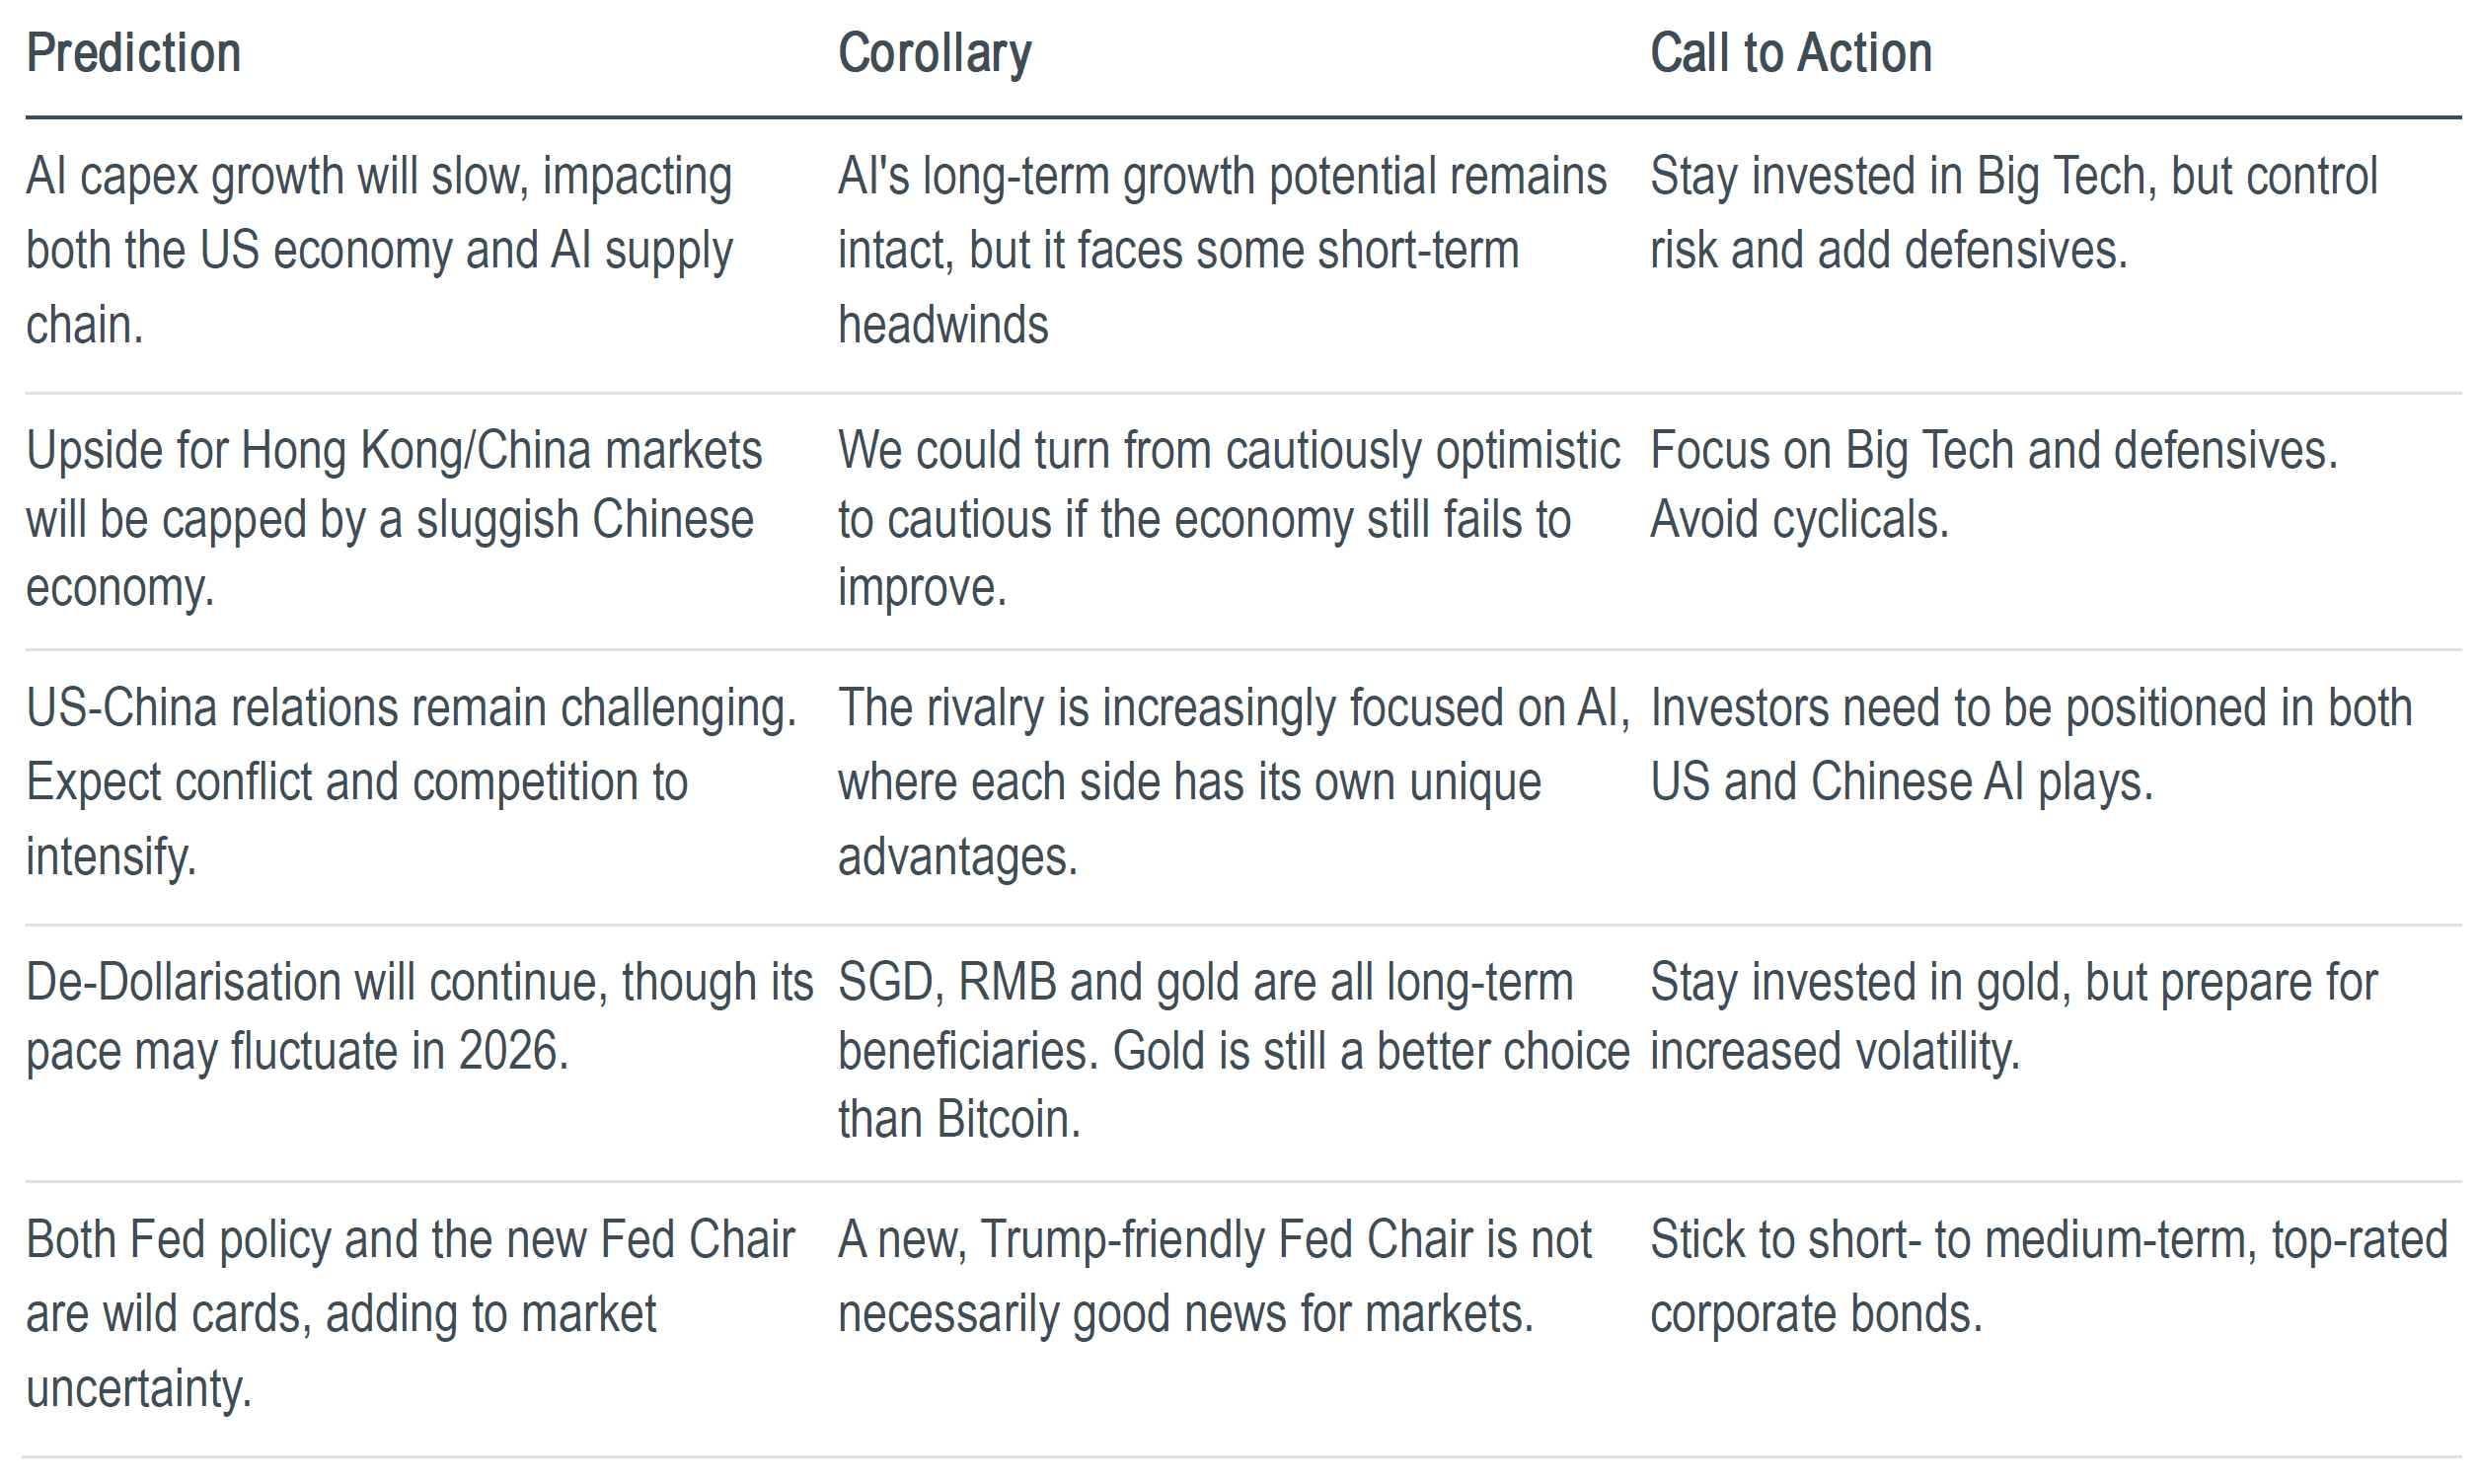
Appendix A: Our Top Five Predictions for 2026
Appendix B: Must Watch Events for August 2026
Date | Macro Data | Sector / Company Events |
Aug 1 | Macau Jul Casino Revenue |
|
Aug 2 |
| Geely, BYD Jul Sales |
Aug 3 | China Jun RatingDog PMI-Mfg, S&P Jul PMI-Mfg Final | Earnings: PLTR, WuXi AppTec (2359.HK) |
Aug 4 | US Jun Exports & Imports | Ai4 Conference Las Vegas (till Aug 6) Earnings: HSBC (0005.HK), SPCX, AMD, BKNG, CAT, MCD, MRK |
Aug 5 | China Jul RatingDog PMI-Svcs, S&P Jul PMI-Svcs Final | Earnings: LLY, APP, SNDK, OXY, DIS |
Aug 6 | US Initial Jobless Claims | Unitree IPO Pricing. Earnings: COP, DBS |
Aug 7 | China Jul Exports, FX Reserves, Taiwan Jul Exports, US Jul Labor Data (NFP) | Earnings: Cambricon (688256.SH), UOB, OCBC |
Aug 8 |
| Montage (6809.HK) IPO lockup expires. Earnings: BRK/B |
Aug 9 | China Jul CPI/PPI |
|
Aug 10 |
| TSMC July Monthly Sales, Unitree IPO Subscription Date |
Aug 11 |
| Earnings: LITE |
Aug 12 | US Jul CPI | Earnings: Tencent (0700.HK), Galaxy (0027.HK), Unicom (0762.HK) |
Aug 13 | US Jul PPI, China Jul M2 Money Supply, New Yuan Loans, Outstanding Loan Growth, Total Social Financing, Initial Jobless Claims
对话 CIO 系列私享会 #11:韓國豪賭歐亞算力,中美AI 競賽正酣7:30-8:30PM | Earnings: AMAT, China Mobile (0941.HK), SMIC (0981.HK), JD.com (9618.HK), Lenovo (0992.HK) |
Aug 14 | US Jul Retail Sales | Earnings: PetroChina (0857.HK) est, Weichai Power (000338.SZ) est, Agricultural Bank of China (1288.HK) est, Meituan (3690.HK) est, China Shenhua Energy (1088.HK) est, BYD (1211.HK) est, CGN Power (1816.HK) est, Sinopec (0386.HK) est, Kweichow Moutai (600519.SH), Great Wall Motor (601633.SH) est, MTR (0066.HK) est, China Telecom (0728.HK) est, CCB (0939.HK) est |
Aug 17 | China Jul Retail Sales, Industrial Production, Fixed Asset Investment (YTD), Unemployment rate, US May House Price Index
| Unitree IPO Listing est (till Aug 19) Earnings: Geely (0175.HK) |
Aug 18 | English CIO Series #38: Asia's AI Moment - What Investors Need to Know 6:30-7:30PM https://events.teams.microsoft.com/event/f847c65f-82ed-4182-89c5-e7f74f5a96d6@7eadc1e1-1a4d-4f70-9305-931a048687ff | Earnings: HD, BHP |
Aug 19 |
| Earnings: TJX, CR Beer (0291.HK) |
Aug 20 | FOMC Jul Minutes, US Initial Jobless Claims | Gamescom 2026 (till Aug 24) Earnings: WMT, Ping An (2318.HK), Chongqing Machinery (2722.HK) |
Aug 21 | S&P Global PMI-Mfg & Svcs Flash. CIO Series Luncheon (Hong Kong): US Market Outlook with Nasdaq. 12:00-2:30PM (In-person event)
| Earnings: Zijin (2899.HK) |
Aug 25 | CIO Series Forum (Singapore): Macro Shocks vs. AI Tailwinds. 5:30-7:00PM (In-person event)
| Earnings: Luxshare (002475.SZ) |
Aug 26 | US 2Q GDP, US Jul Personal Income/Spending, US Jul PCE | Earnings: NVDA, Gree Electric (000651.SZ), Anta (2020.HK) |
Aug 27 | US Jackson Hole Symposium (till Aug 29), US Initial Jobless Claims, China Jul Industrial Profits (YTD) | Earnings: MRVL est, CNOOC (0883.HK) est, Innovent (1801.HK) est, Trip.com (9961.HK) est, China Overseas Land (0688.HK) est, |
Aug 28 |
| Earnings: Haier (6690.HK) est, Alibaba (9988.HK) est, CR Land (1109.HK), Li Auto (2015.HK) est. |
Aug 29 |
| Earnings: ICBC (1398.HK) est |
Aug 31 | China Jul NBS PMI | China Jul NBS PMI & China’s Top 100 Developer Real Estate Sales. |
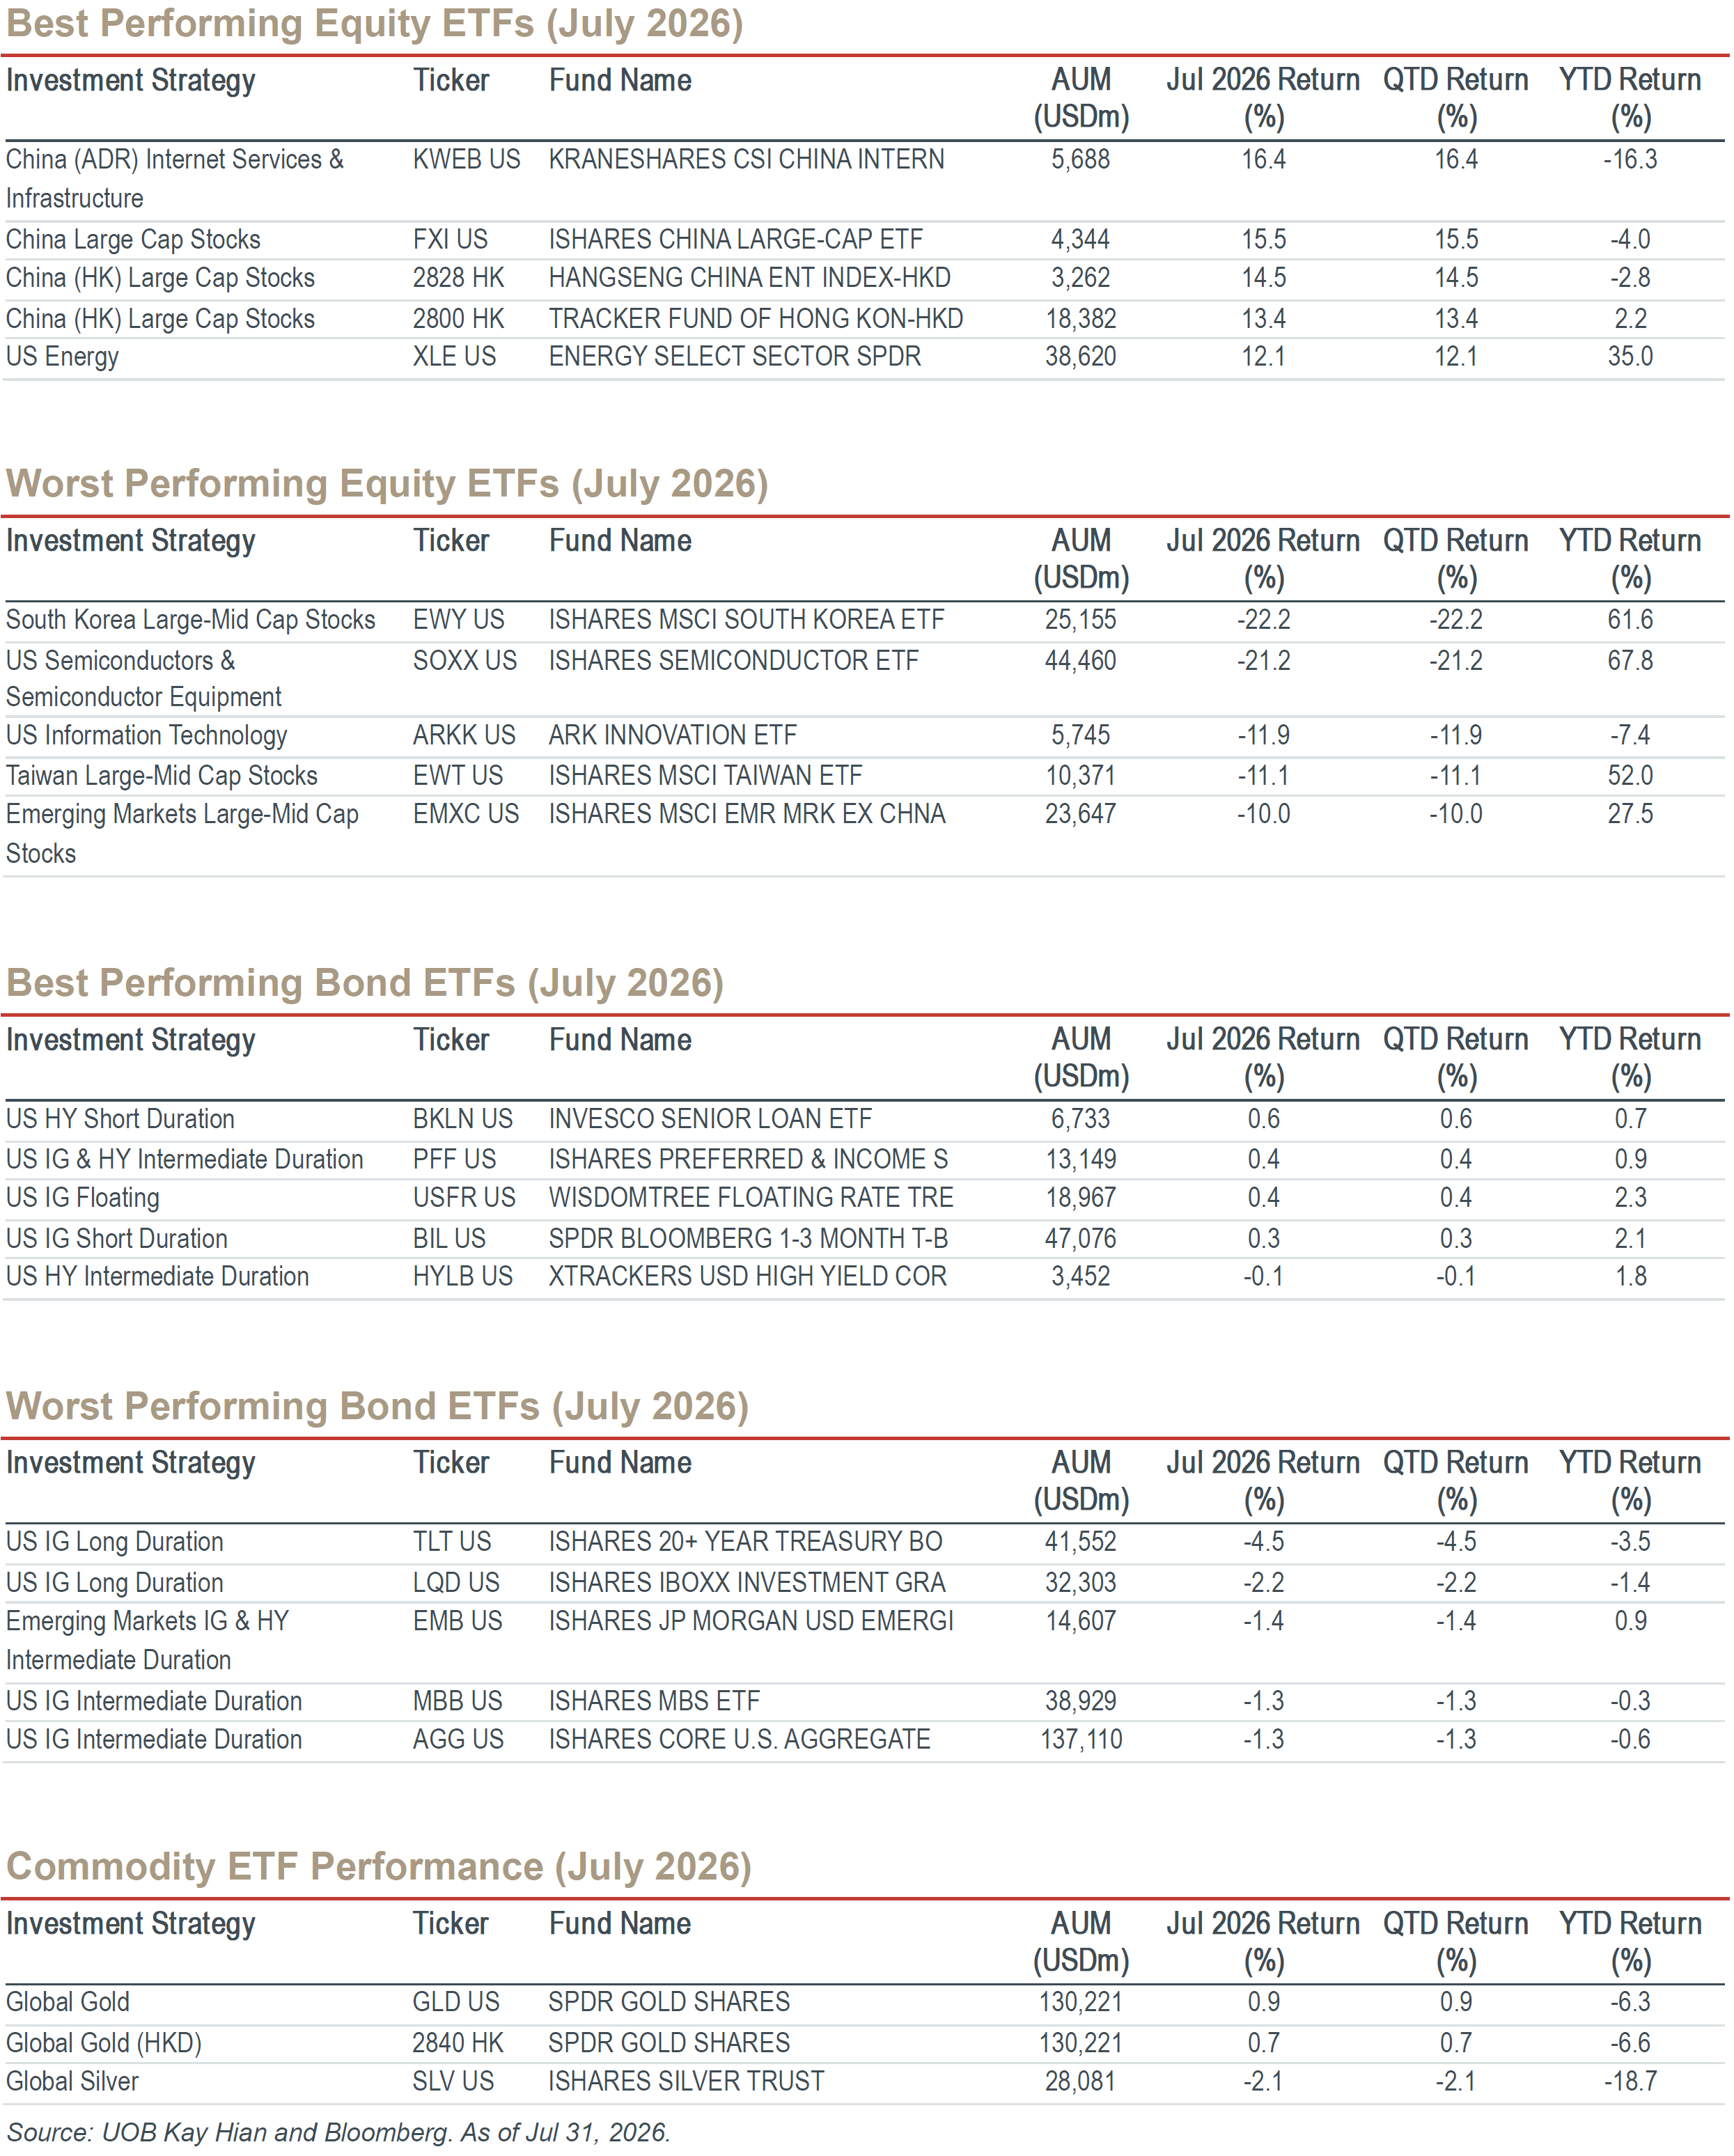
Appendix C: Global ETF Toolkit Highlights
Appendix D: Roadmap to Private Wealth Management Research
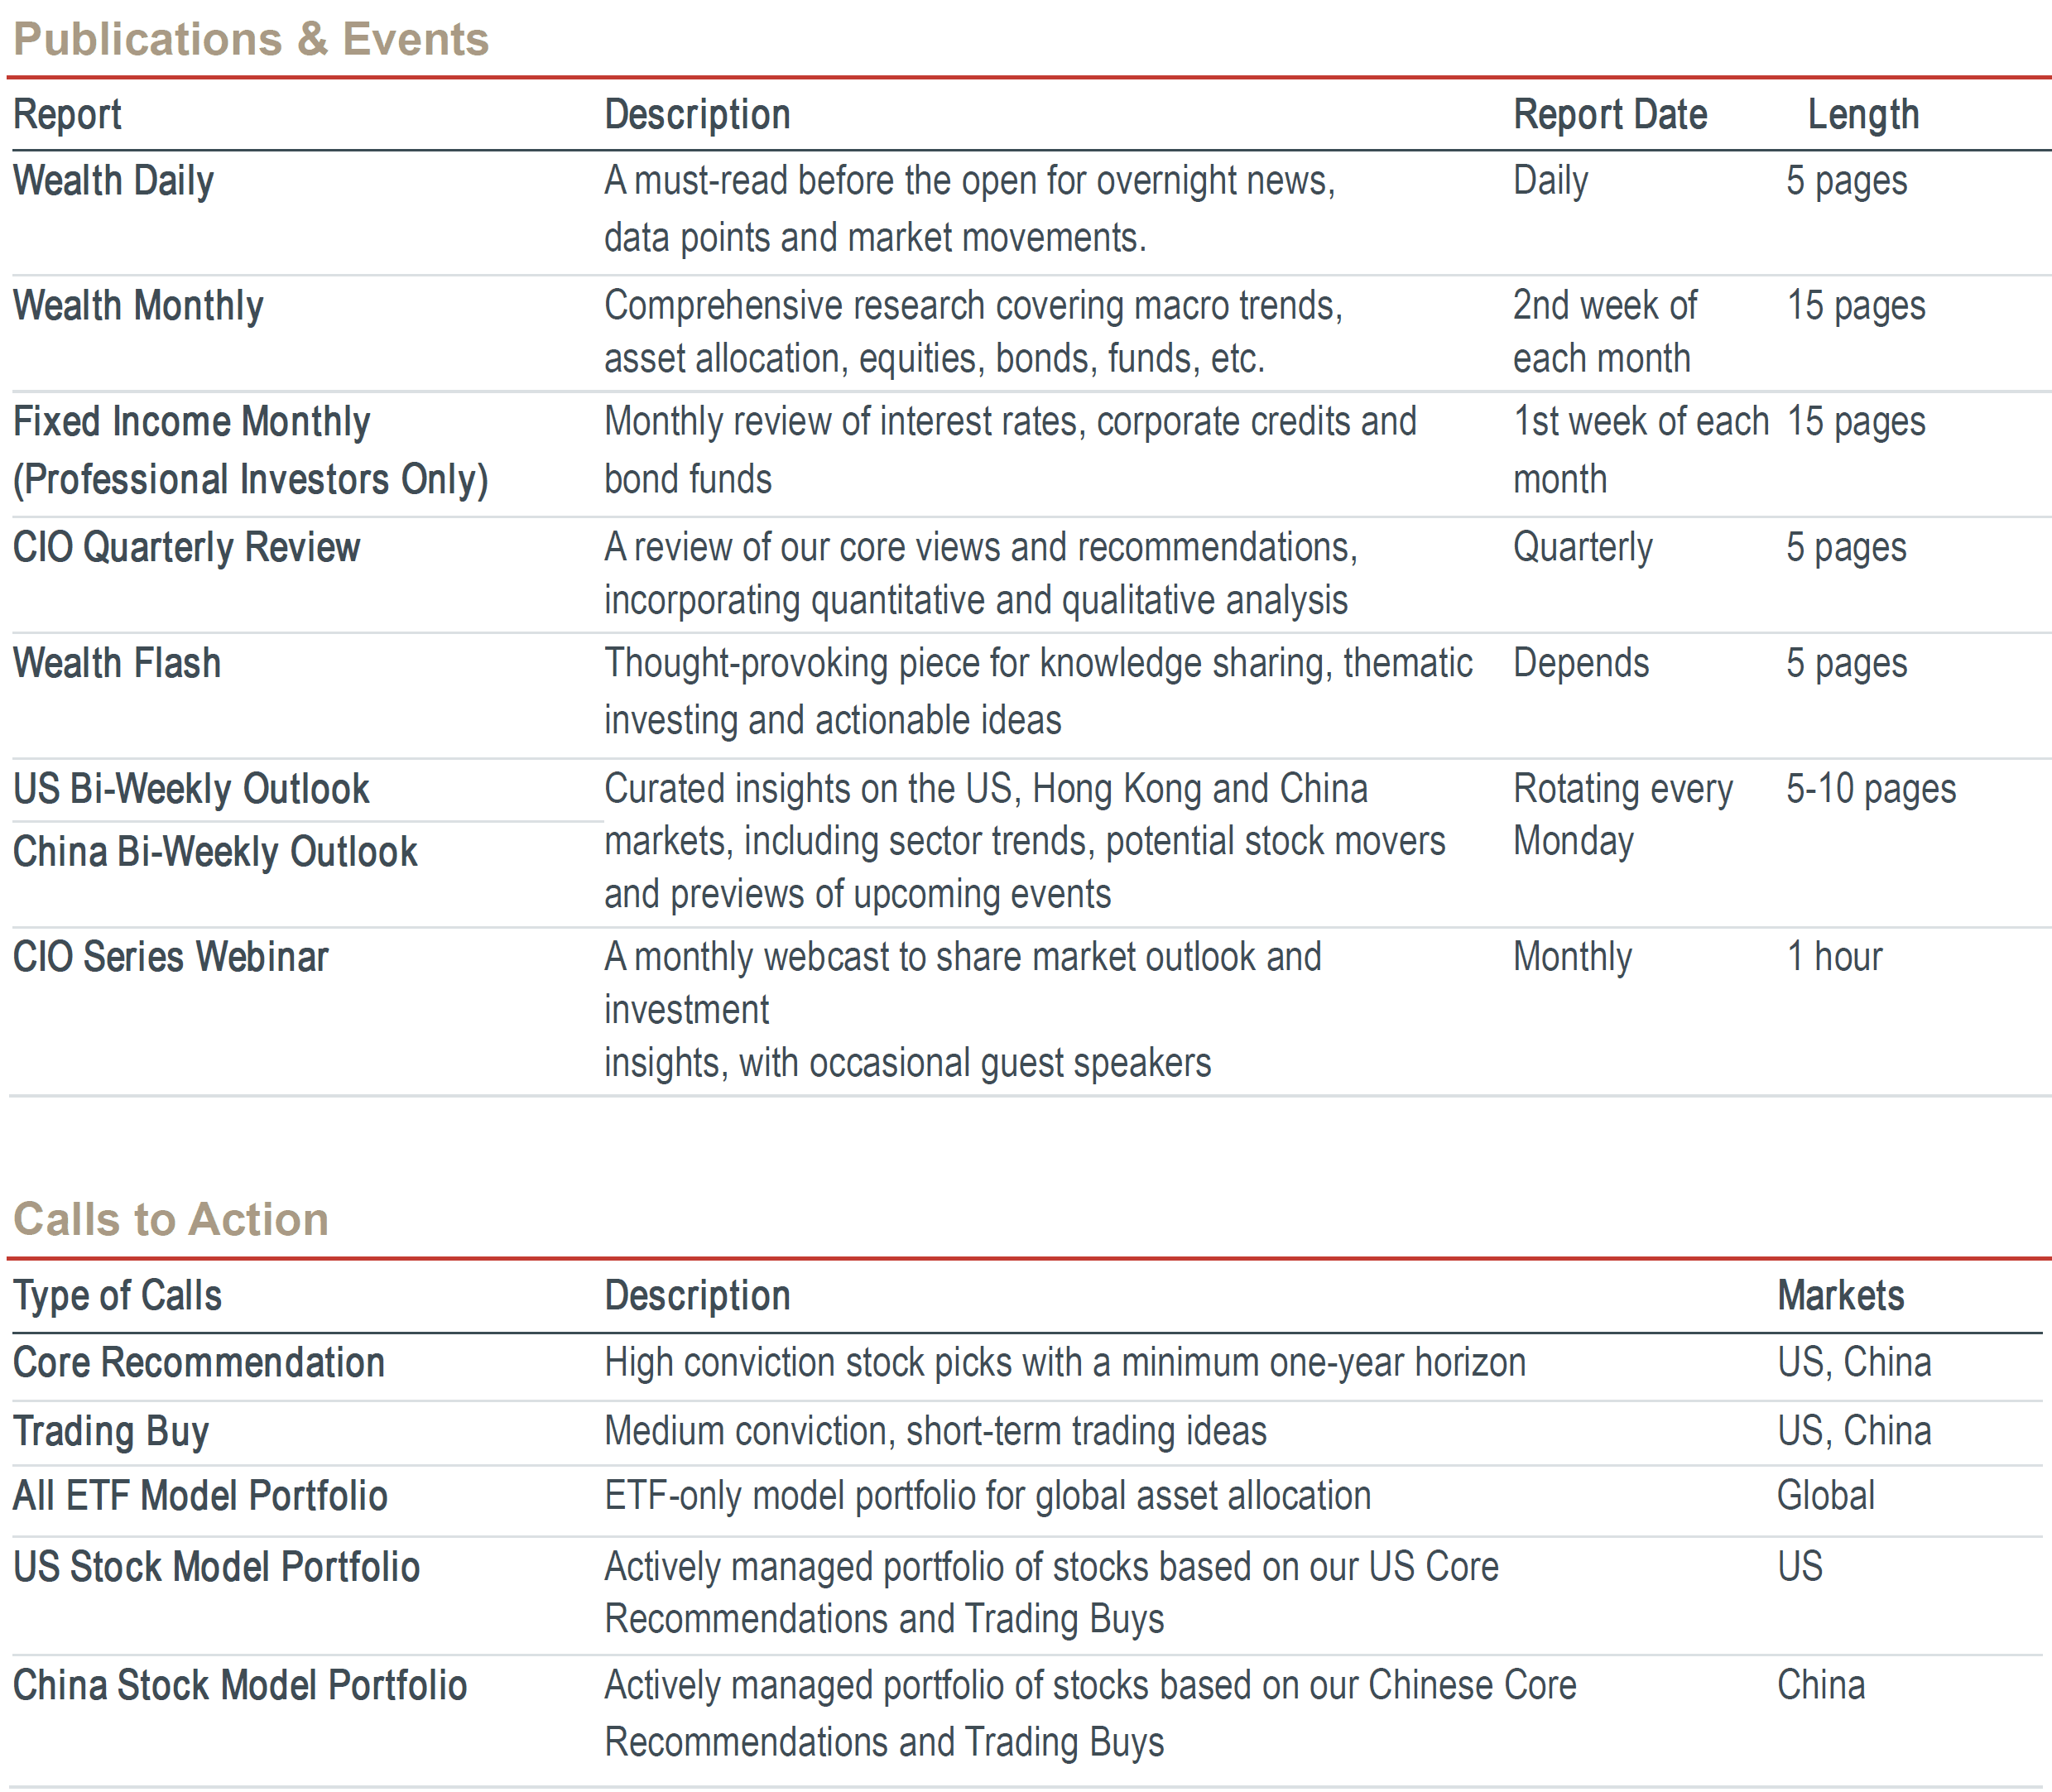
Note: Report lengths are approximate and may vary. Please contact research@uobkh.com if you’d like to subscribe to any research above.
Be sure to subscribe to our Wealth Vision YouTube channel, including replays of our CIO Series and much more.
https://www.youtube.com/@uobkh_wealthvision
Appendix E: UOB FX, Interest Rates & Commodities Forecasts
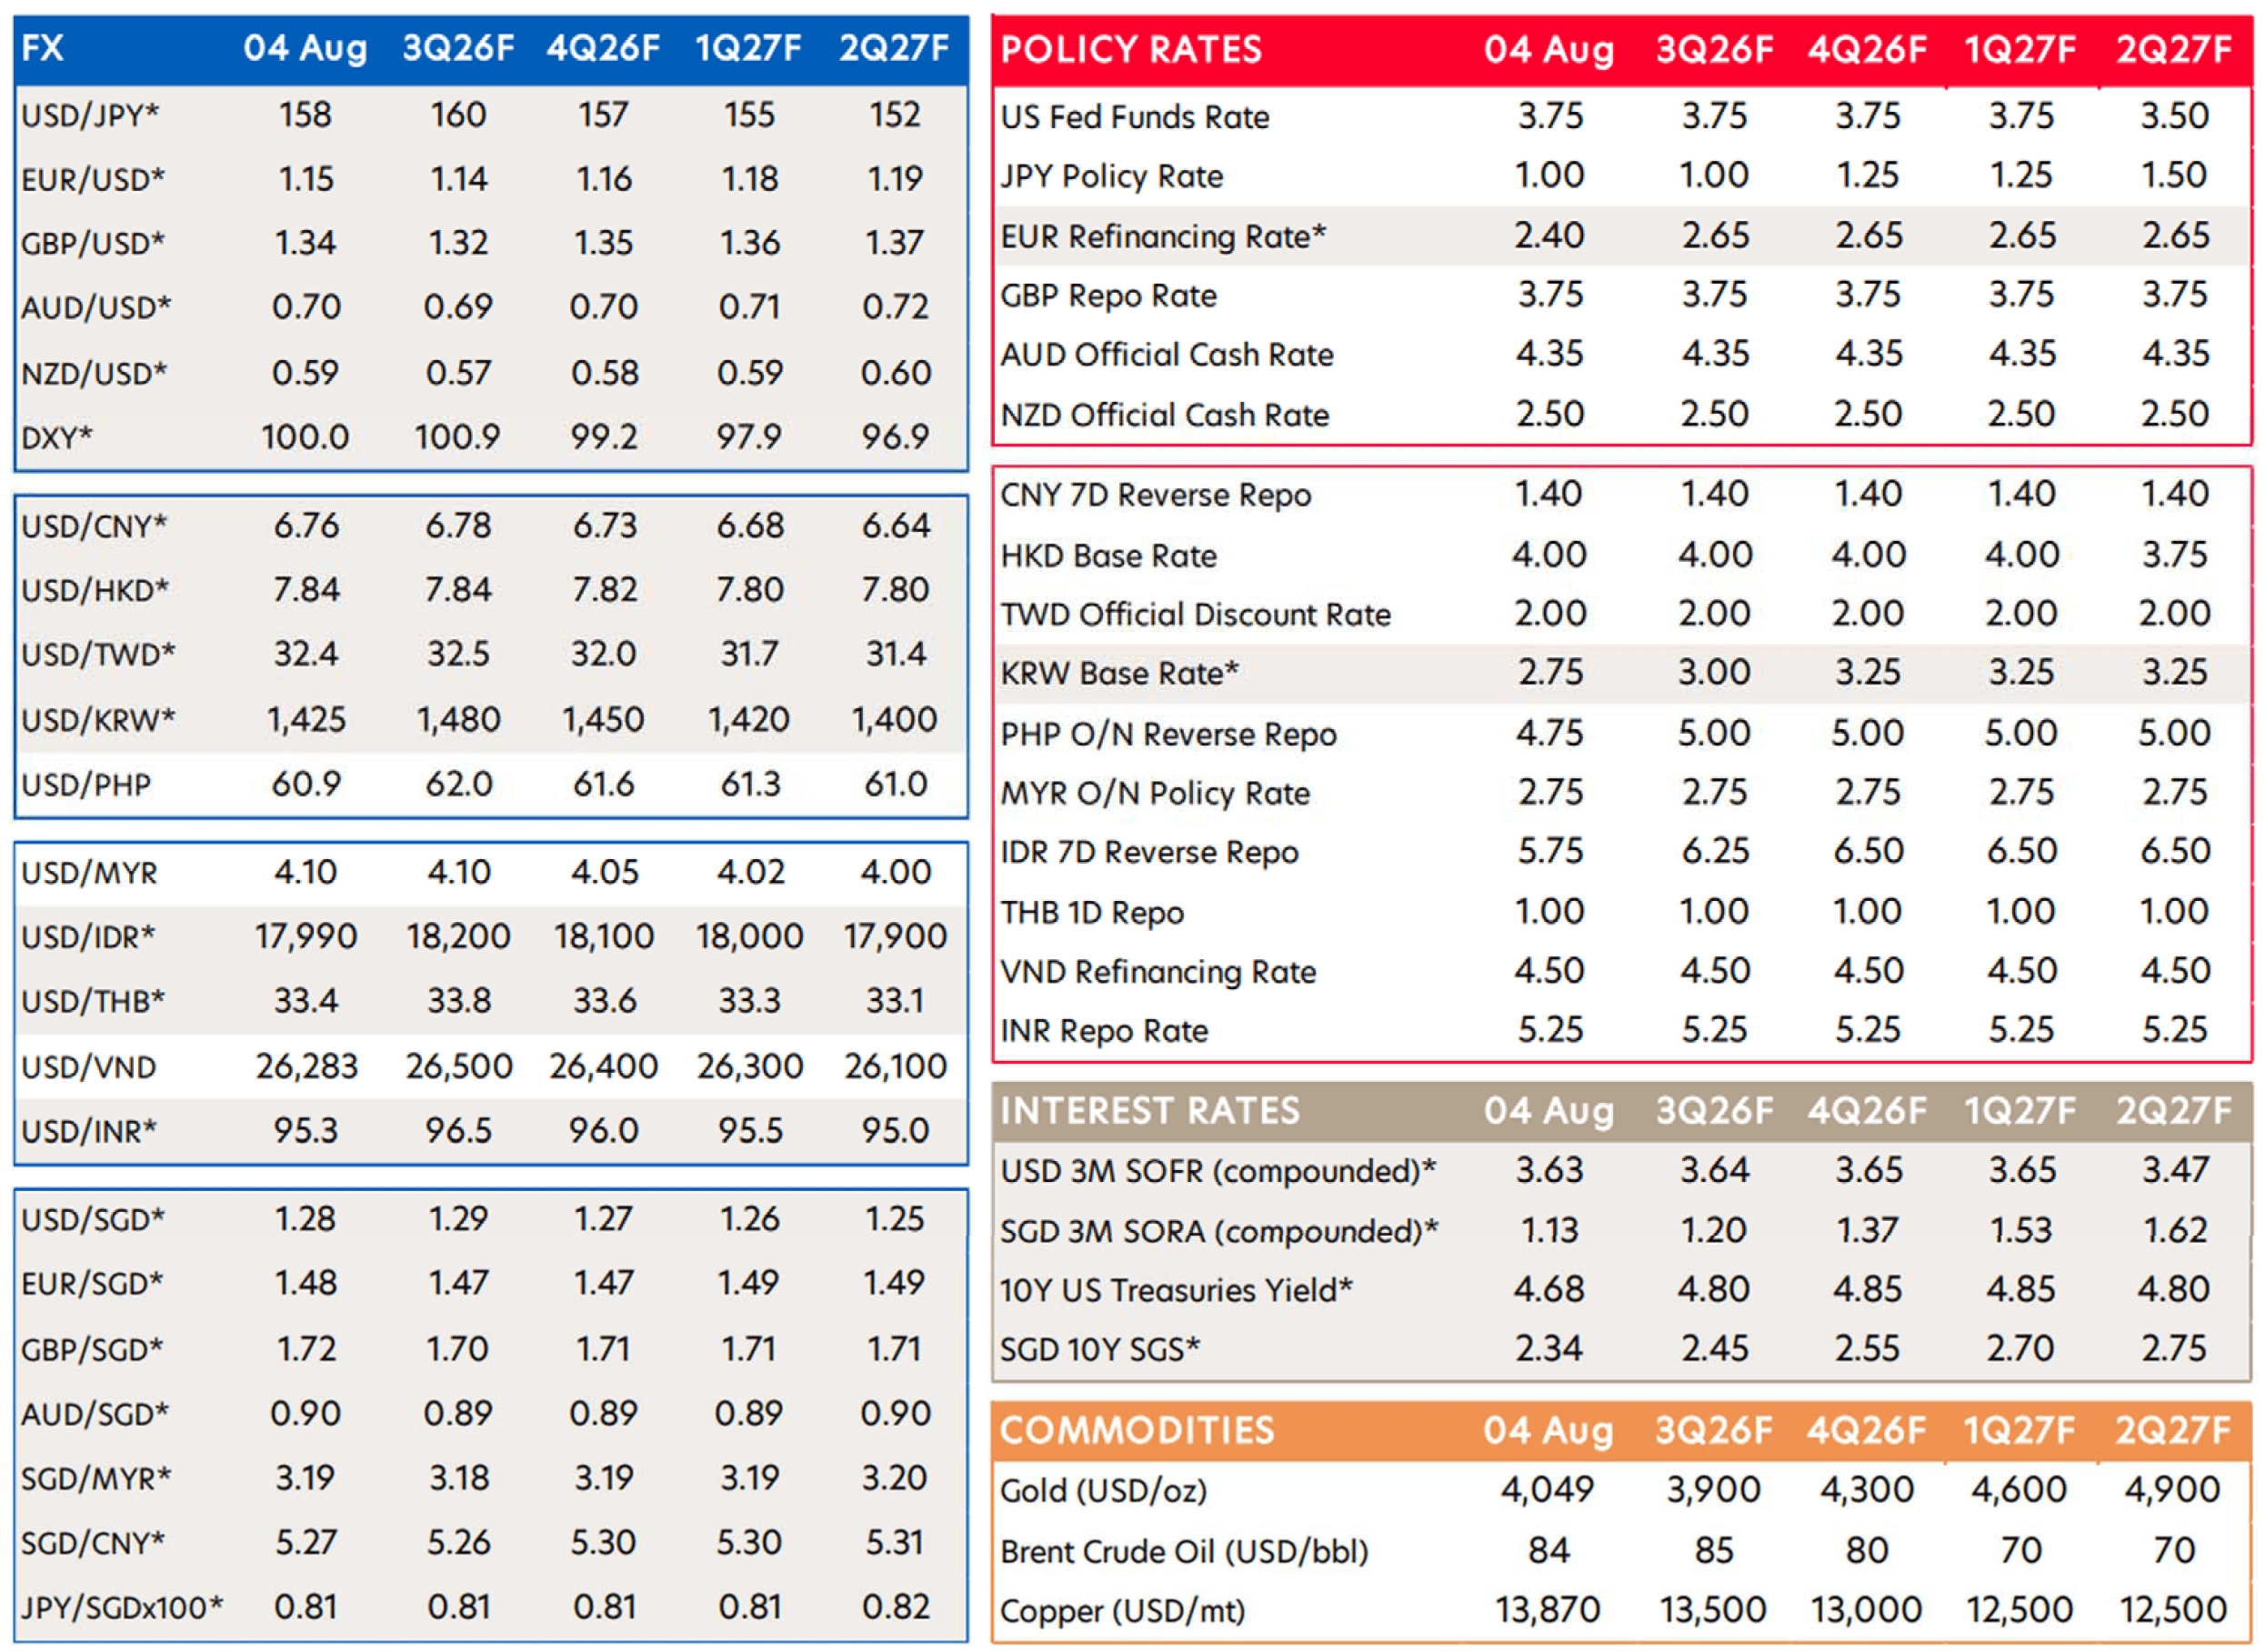
Source: UOB Research, Bloomberg (Updated as of 4 August 2026)
* Forecasts updated as compared to previous report dated 02 July 2026
CIO Summary
- AI fundamentals remain strong, as evidenced by both hard industry data and the latest company earnings. July’s violent rotation out of semiconductors and other AI-related stocks was mainly driven by deleveraging, high market expectations and negative investor narratives.
- Macro headwinds vs. AI tailwinds. Persistent macro uncertainties, including geopolitical risks, elevated oil prices, higher bond yields and the Fed wildcard have amplified AI sector volatility and contributed to the rotation. Macro risks could gradually gain the upper hand, leading to a potential market awakening likely around September-October.
- Join our CIO Series events in August to navigate this complex and challenging environment, with curated insights and expert opinions. Details inside.
- Our All ETF Model Portfolio for global asset allocation was down 0.4% in July but still up 4.6% YTD. The Hang Seng Index ETF (2800.HK) and the Energy Sector ETF (XLE) were the largest contributors, while the Semiconductor ETF (SOXX) and Emerging Markets ex. China (IEMX) were the biggest detractors.
- Our US Stock Model Portfolio lost 0.6% in July but still gained 6.8% YTD. Top 3 performers: MSFT +24.6%, OXY +17.5% and SNOW +15.2%.
- Our China Stock Model Portfolio gained 2.8% in July yet remained down 3.5% YTD. Top 3 performers: 9988.HK +26.0%, 2899.HK +23.1% and 0300.HK +20.3%.
- Fixed income strategy: maintain our Core Recommendation on high-quality, investment-grade bonds with short durations (< 3 years).
- Commodities: Continued central bank buying provides long-term support, reinforcing gold (2840.HK or GLD) as a top beneficiary of de-dollarisation.
Core Views and Recommendations
Asset Class | Core Views | Core Recommendations |
Equities | We remain cautious on global equities given the confluence of tariffs, geopolitical risk and extreme market concentration (related to AI). The Iran oil shock adds another layer of macro uncertainty by further lifting inflation, dampening growth and raising policy challenges. | Underweight equities in global asset allocation. See our All ETF Model Portfolio below. |
US Equities | We are cautious on US equities for the same reasons above (including the “Fed Wildcard”), compounded by valuation concerns. Within US equities, we maintain high conviction in AI’s long-term growth potential, despite concerns over macro uncertainty and concentration risk. We also favour well-managed, “true defensive” companies, which continue to demonstrate stability and resilience in an uncertain macro environment. We continue to like energy – both as a hedge against geopolitical risks and a key beneficiary of surging AI electricity demand. | Underweight US equities in global asset allocation (All ETF Model Portfolio) AI: AMZN, AVGO, META, MSFT, NVDA Defensives: BRK/B, JNJ, PG, WMT, XLP Energy: OXY, XLE, GEV Others: LLY See our US Stock Model Portfolio below. |
China Equities | We are cautious on China due to continuing macro weakness (“China’s Growing Pains”), characterized by a subdued real estate market and sluggish domestic demand, coupled with external shocks and a lack of stimulus. Having said that, the Iran oil crisis may be a blessing in disguise for China, as it could amplify Beijing’s manufacturing edge and supply chain dominance, thus benefiting industrial production and exports. Within China equities, we also favour AI, defensives and energy. | Overweight China equities in global asset allocation (All ETF Model Portfolio) AI: 0700.HK, 9988.HK, TSM Defensives: 0941.HK, 0005.HK, 0300.HK Energy: 0857.HK, 300750.SZ / 3750.HK Others: 0027.HK, 0175.HK, 9961.HK See our China Stock Model Portfolio below. |
Fixed Income | Bonds remain an essential asset class in a multi-asset portfolio, offering stable income, capital preservation, and diversification. Current bond yields also remain attractive relative to long-term inflation expectations. However, the US fiscal imbalance and the related de-dollarisation trend could be potential game changers for fixed-income investing. In addition, both the Fed policy and the new Fed chair are wildcards, adding to market uncertainty in 2026. | Overweight bonds in global asset allocation (All ETF Model Portfolio). We have changed our Core Recommendation from intermediate-term (5-7 years) IG bonds to short-duration (<3 years) bonds. Build a currency-diversified fixed income portfolio, incorporating local currency and FX hedged bonds or bond funds. See Appendix E for UOB’s currency views. |
Commodities | We expect de-dollarisation to continue in 2026 and beyond with gold as a top beneficiary of this long-term trend. | Overweight gold in global asset allocation (All ETF Model Portfolio). |
CIO Commentary
Rotation defined global markets more than just volatility in July. This was evident across asset classes, regions, equities, and even within the AI sector. Such dynamics suggest that:
- Risk appetite for equities remains intact, despite ongoing geopolitical uncertainty, macro headwinds, the Fed Wildcard and AI concentration risk. However, we continue to believe investors may be too complacent about Fed rate hikes and global tightening risk. September-October remains a potential window for a major market awakening, where volatility could exceed prior levels.
- Rotations suggest investors may be conflicted with recurring macro headwinds (top-down) and continuing strong AI fundamentals (bottom-up). You can hardly blame them for the frequent shifts in positioning. After all, the world is becoming increasingly difficult to decipher. For one thing, AI is no longer just a Silicon Valley innovation, but a disruptive force that could fundamentally change geopolitics, economic structure, fixed income, equities and even Fed policies.
As a firm that is “Serious about investing”, UOB Kay Hian is dedicated to helping you navigate this complex and challenging environment, so that you can act with clarity and conviction. Please continue to follow our research and join our CIO-led events, where we bring together curated insights, actionable ideas and a trusted network of investment specialists.
Below are our CIO Series events this month, featuring leading third-party experts. We hope you can join us.
Date & Time | Event | Guest Speaker | Location | Language | Registration |
7:30PM | 对话CIO系列私享会 #11: 韩国豪赌欧亚算力,中美 AI 竞赛正酣 | 江经宇, | Online | Chinese | https://voovmeeting.com/dw/sRpVvYXw7IHv? https://meeting.tencent.com/dw/sRpVvYXw7IHv? |
6:30PM 18 Aug | CIO Series #38: Asia's AI Moment - What Investors Need to Know | Dan Kiang, Founder and CIO of Aqua Lake Capital | Online | English |
|
12:00PM 21 Aug | CIO Series Luncheon: US Market Outlook | Phil Mackintosh Chief Economist Nasdaq | Hong Kong | English | RSVP Iris Lee (iris.lee@uobkh.com) |
5:30PM | CIO Series Forum: Macro Shocks vs AI Tailwinds | Phil Mackintosh Chief Economist Nasdaq | Singapore | English |
Asset Allocation (All ETF Model Portfolio)
Source: UOB Kay Hian and Bloomberg. As of July 31, 2026.
- Our All ETF Portfolio for global asset allocation was down 0.4% in July yet still up 4.6% YTD. The Hang Seng Index ETF (2800.HK) and Energy Sector ETF (XLE) were the largest contributors, up 13.4% and 12.1% respectively. Meanwhile, Semiconductor ETF (SOXX US) and Emerging Markets ex-China ETF (IEMX) were the biggest detractors, down 21.2% and 10.0% respectively.
- US equity UNDERWEIGHT (30.6% vs. 36.1%). We do not intend to increase US equity exposure until the Fed’s first rate hike, which the market expects in September but we still anchor to December. In the meantime, there remain ample trading opportunities from sector rotation. In July, we took profits in the Energy Sector ETF (XLE) after a brief oil spike and also trimmed the Industrial Sector ETF (XLI). Proceeds were redeployed into Nasdaq-100 (QQQ) and the Semiconductor Sector ETF (SOXX) during the recent pullback, as we believe the sharp correction offers an attractive buying opportunity.
- Developed Markets ex-US UNDERWEIGHT (10.2% vs. 16.4%). DM ex-US (IDEV) gained 1.7% in July, driven by strength in European equities yet dragged by Japan amid the sell-off in AI and semiconductors. Despite the ups and downs, IDEV remained up 11.4% YTD.
- Emerging Markets ex-China UNDERWEIGHT (4.1% vs. 5.6%). EM ex-China (EMXC) declined 10% in July after a sharp sell-off in Korea (also AI-related) but remained up 27.5% YTD.
- China equity OVERWEIGHT (7.1% vs. 2.2%). We took profits in the Hang Seng Index ETF (2800.HK) after its strong rally and after the index hitting our preset target in July.
- Fixed income EQUAL-WEIGHT (40.0% vs. 39.7%). Fixed income held steady amid equity market volatility, down just 0.5% in July vs. a 2.2% decline in global equities. The intermediate term corporate bond ETF (VCIT) fell 1.3% in July and remained down 0.6% YTD, while the short-term corporate bond ETF (VCSH) slipped only 0.2% in July and remained up 0.8% YTD. This has confirmed that our Core Recommendation to stay short-duration is working.
Gold OVERWEIGHT (5.4% vs. 0.0%). The Gold ETF (2840 HK) gained 0.7% in July yet remained down 6.6% YTD. We continue to view gold as a portfolio diversifier and a long-term hedge against geopolitical risk, currency volatility and the de-dollarisation trend.
Equities
US Equities
July was a month of extreme volatility, which isn’t obvious as the S&P 500 was down only 0.1% last month. Beneath the calm surface, the Nasdaq fell 3.2% while SOXX collapsed 21.2%, driven by a cascade of macro uncertainties, stretched expectations, bearish narratives, deleveraging squeezes and retail sentiment swings. Our US Strategist Wendy Chen was spot-on with her call on this rotation. Access the replay of our joint-CIO Series webinar if interested.
- Narrative-driven panic over AI. The market panic was triggered by a series of negative narratives on AI: (1) News of Meta's plan to lease out compute was misread as a signal of compute oversupply and impending capex cuts; (2) the release of Chinese open-source model Kimi K3 sparked fears of a price war with existing frontier models (Anthropic, OpenAI); (3) Chinese DUV lithography progress triggered a semiconductor equipment sell-off and concerns that US AI firms may be losing ground across the entire stack. Last but not least, macro events such as renewed Middle East tensions, a resurgence in oil prices, rising bond yields and the Fed Wildcard also amplified the sell-off.
- AI fundamentals remain intact. Despite a long list of worries, data points have yet to point to a meaningful deterioration in AI fundamentals. GPU rental prices continued to surge 50%-60% over the past seven months, while Meta, Google and Amazon all raised full-year capex guidance during 2Q results – among other supportive evidence.
- Broad earnings fundamentals remain intact. Beyond just AI, the broader earnings backdrop remains remarkably robust: 86% of S&P 500 companies that have reported 2Q earnings so far beat estimates, with a staggering 47% yoy increase in EPS – up from the 27% growth in 1Q. As a result, Wall Street has lifted full year earnings growth estimates for the S&P 500 and Nasdaq to 29.3% and 46.1%, respectively. For AI hardware stocks, higher earnings estimates but lower stock prices mean a significant PE compression, with the forward PE of S&P 500 Info Tech sector now down to a 4-year low (see chart below).
- Potential credit market headwinds. While AI and tech equity risks are mainly illusory, the credit market could face real AI-related headwinds, with hyperscaler CDS spreads skyrocketing and potential spillovers to other markets. Refer to our Fixed Income section below for more information.
- Short-term outlook constructive. The late-July collapse of a once-USD 45bn AI fund triggered the second-largest de-grossing of the past decade – which has now concluded. Aggressive deleveraging and systemic cleansing of levered positions appear to be ending. We foresee a cleaner technical tape ahead, allowing investors to refocus on AI fundamentals. S&P 500 has been following our playbook of "range-bound with an upward bias" in the short-term. Our view is unchanged.
- Medium-term caution warranted. Beyond September and into 4Q, however, we advise investors to be wary of a potential market awakening, as the rate hike risk and midterm election uncertainty may begin to price in more aggressively.
Source: UOB Kay Hian and Bloomberg. As of July 31, 2026.
- Our US Stock Model Portfolio lost 0.6% in July yet remained up 6.8% YTD, underperforming S&P 500 (SPY) – which was flat in July and up 10.1% YTD. The July lag was driven by Industrials (GEV -15.7%), Technology (NOK -30.8%, LITE -16.8%, SOXX -21.2%) and Communication Services (APP -23.2%), partly offset by gains in Energy (OXY +17.5%, XLE +12.1%), Consumer Discretionary (AMZN +13.9%) and Software (MSFT +24.6%).
- Cash remained largely unchanged at 15.3% at July-end, reflecting our portfolio rotation strategy, with purchases funded by sales. We added to JNJ, PG, WMT, XLV, NVDA, META and SOXX, with money from exiting MU and QCOM, as well as trimming AVGO, LITE, MSFT, AMZN, SKHY, XLE and OXY.
- Top 3 performers: MSFT +24.6%, OXY +17.5% and SNOW +15.2%.
- Bottom 3 performers: NOK -30.8%, APP -23.2% and SOXX -21.2%.
- Alphabet (GOOGL) reported strong 2Q results. Revenue grew 24% yoy to USD 119.8bn, slightly ahead of expectations, while EPS of USD 2.85 came in slightly below consensus. Advertising revenue remained resilient, and Google cloud surged 82% to USD 24.8bn, exceeding elevated buyside expectations of 70%+ growth. The company's order backlog increased by 11.7% qoq to USD 514bn, highlighting sustained demand visibility. Bearish arguments focus on the company’s first-ever negative free cash flow (FCF) and cloud margin possibly peaking. However, we remain constructive on GOOGL, as its robust backlog reaffirms continuing strong AI demand.
- Amazon (AMZN) reported a strong 2Q with revenue rising 20% yoy to USD 201bn, 2% ahead of consensus. EBIT reached USD 27.5bn, comfortably beating the USD 26bn consensus. AWS was the standout driver, with revenue surging 37% versus already elevated buy-side expectation of 35% growth. Backlog also increased 36% qoq to USD 496bn. Management raised FY2026 capex guidance to USD 220bn (from USD 200bn) primarily due to higher memory-related costs. Management also offered crucial insights into AI data center economics, stating that servers have a 5-to-6-year useful life, AI capacity is contracted for five years, and capital investments will reach breakeven under three years (implying a 30%+ IRR). This narrative immediately boosted investor sentiment on hyperscaler stocks, leading to a 15% surge in AMZN shares in a single day. We maintain our positive view on Amazon, supported by its leadership in cloud computing and now the compelling return on AI investments. The stock currently trades at 21x forward PE, with earnings expected to grow 14.8% in 2026E and 13.2% in 2027E.
- Nokia (NOK) reported a beat-and-raise for 2Q. Revenue grew 9% yoy to EUR 4.82bn, and comparable operating profit rose 18% to EUR 434mn (beating the EUR 382mn estimate). Net sales to AI and cloud clients more than doubled, while new order booking reached EUR 2.8bn – highlighting robust AI networking demand. The company said the backlog offers solid revenue visibility well into late 2027 and 2028 – a positive surprise. We believe Nokia will continue to capture massive AI infrastructure growth, by leveraging decades of carrier-grade IP and optical networking expertise.
- Microsoft (MSFT) reported a solid earnings beat. Azure grew 43%, exceeding the +40% expectation, with management guiding for further acceleration. Copilot was another bright spot, with users reaching 30m versus the 25m expectation, and penetration remaining low at 5%. The results offered further validation for Microsoft’s AI-driven cloud business model, supporting the case for increasing its capex.
- Meta (META) reported largely in-line results. 2Q revenue grew 28% yoy to USD 60.8bn – slightly above the 60.2bn consensus. However, the midpoint of its 3Q revenue guidance came in below consensus. Despite strong advertising growth, investors are increasingly demanding clarity on how Meta’s AI capex will translate into tangible monetization beyond ads. We agree that Meta’s AI endeavors lack further visibility in the near term, but its core advertising business continues to deliver impressive growth. AI monetization is still very early for Meta – patience is recommended.
- SK Hynix (SKHY) reported a 2Q earnings miss, with revenue of KRW 79.32tr (USD 56.4bn, +51% qoq), below the KRW 84tr expectation. Operating profit reached KRW 60.54tr (USD 43bn), also below the consensus of ~KRW 63tr. The miss was primarily attributable to a higher mix of HBMs with fixed prices under Long-Term Agreements (LTAs), which are below current market prices. It seems Hynix tries to prioritize revenue visibility over profit maximization – a prudent strategy given the volatile environment. During the call, management also confirmed that it’s reviewing several options – including special dividends, dividend increases, and share buybacks and cancellations – to enhance shareholder returns. This represents another shareholder-friendly initiative that should support the stock's long-term performance, in our view.
- AppLovin (APP) reported a 2Q earnings miss, with revenue and earnings both up 53%+ yoy but still 5% below consensus. Management attributed the weakness to product timing, as the updated recommendation engine was only launched at quarter-end – a one-time issue. However, its advertisement targeting performance is also slowing down – which is worth noting. Without ad tech advancement and significantly wallet share gains, our APP investment thesis could be weakened. We are still evaluating whether such mis-executions are inherent to APP’s cutting-edge technologies or indicative of deeper issues within the company. Our Trading Buy rating is currently under review.
- Johnson & Johnson (JNJ) reported a solid beat-and-raise, with organic sales growing 5.7% yoy while adjusted EPS rising 4.7% yoy – both beating estimates by 1%. Pharma was the standout driver, delivering 6.9% organic growth despite a 760-bps Stelara headwind, fueled by a 71% surge in TREMFYA and rapid ramp-ups of INLEXZO and ICOTYDE. MedTech sales grew 3.7% yoy, with Orthopedics, Surgery and Vision all posted earnings beats. Management remained highly confident in underlying MedTech procedure trends, seeing no slowdown on regulatory impact, while expecting acceleration across all four MedTech segments in 2H2026. Additional positive developments recently:
o Significant pipeline expansion through acquisition. JNJ completed a USD 1bn acquisition of Firefly Bio to strengthen next-generation antibody engineering for tumors, and committed USD 785mn upfront for Sail Biomedicines to expand its autoimmune pipeline.
o Legal overhang reduction. JNJ announced an estimated USD 5.5bn settlement covering ~76,000 ovarian cancer-related talc claims, which, subject to approval, would resolve most outstanding lawsuits and improve visibility over future liabilities.
JNJ remains our Core Recommendation and one of our "True Defensive" holdings. The stock currently trades at 21x forward PE with revenue/earnings expected to grow 7%/10% in both FY2026 and FY2027.
- Eli Lilly (LLY) reported another beat-and-raise, with revenue of USD 23bn (+48% yoy, 12% ahead of consensus), and EPS of USD 8.40 (+33% yoy, well above consensus). Eli Lilly’s flagship weight-loss and diabetes drugs (GLP-1 related), Mounjaro and Zepbound, generated a massive USD 15bn in combined sales, cementing the company's dominant global position. The newly launched oral weight-loss drug, Foundayo, is also capturing a meaningful portion of new prescriptions ahead of a broader global expansion. We reiterate our Core Recommendation on Eli Lilly on (1) its undisputed leadership in the GLP-1 market, (2) ongoing market share expansion outside US esp. China, Mexico, and Europe, and (3) robust non-GLP pipeline to provide next leg of growth, all reinforced by its status as an "AI Pharma Powerhouse". Current valuation remains attractive, as the stock trades at 28x forward PE – the low end of its 28x-45x historic range, with stellar earnings growth of 49% in FY2026 and 28% in FY2027 (expected).
- P&G (PG) reported mixed 4QFY2026 results, with flat organic sales – 1% below consensus. Core EPS fell 3% yoy to USD 1.43 but still 1% above consensus. Full-year FY2026 net sales rose 3% to USD 87.0bn, while organic sales grew a modest 1%. In 4Q, Beauty was the only division to deliver organic sales growth (+4% yoy on volume gains), offsetting a 2% decline in Baby, Feminine & Family Care category. Upstream inflation since the Iran conflict still pressured its margin as 4Q core operating margin contracted 1.3 ppt to 19.5%. Looking ahead, FY2027 guidance points to subdued growth of +1-3% in organic sales and +0-3% for core EPS – weighed down by input costs, FX, and restructuring. On the bright side, management noted early signs of market share recovery in China (first share growth in 15 quarters). The stock currently trades at 21x forward PE with GAAP earnings expected to grow 5% in FY2027. We believe PG’s relatively high valuation is fully justified by its “True Defensive” nature, stable earnings and a long track record of paying dividends consistently.
- Occidental (OXY) reported a strong 2Q2026 beat, with adjusted EPS of USD 2.40 versus USD 1.84 expected – its highest quarterly profit since 3Q2022. Realized oil prices rose more than 50% yoy to USD 96.78/bbl, while production increased 2.4% to 1.43mn boepd, partly offset by a 12% decline in international output amid Middle East disruptions. Management lowered FY2026 capex guidance to USD 5.5–5.9bn from USD 6.3–6.7bn and tightened production guidance to 1.42–1.45mn boepd. The midpoint of its 3Q guidance of 1.40–1.44mn boepd implies a modest sequential decline. OXY currently trades at 9.6x 2026E PE and 14.8x 2027E PE, with estimated FCF yields of 9.95% and 6.99%, respectively. While its 2027E cash flow is expected to normalize, the near-term FCF yield remains attractive and provides meaningful capacity for further deleveraging and enhancing shareholder returns – which is a core pillar of our investment thesis.
- Must watch events in August: US Jul Labor data (Aug 7), US Jul CPI (Aug 12), US Jul PPI (Aug 13), FOMC Minutes (Aug 20), US 2Q GDP 2nd estimate & Jul PCE (Aug 26), Jackson Hole Symposium (Aug 27-29). Earnings: LLY, APP & OXY (Aug 5), BRK/B (Aug 8), LITE (Aug 11), WMT (Aug 20), NVDA (Aug 26). For more information, please see Appendix B.
China Equities
The Hang Seng Index surged 13% and MSCI China gained 9% in July, as investor sentiment on China improved temporarily. Overall, this still seems a relief rally, given that macro fundamentals remain weak (China’s Growing Pains) and new stimulus measures are still under discussion.
- China’s Growing Pains deepened in 2Q2026. GDP growth slowed to +4.3% yoy in 2Q, missing the +4.5% consensus and below the 5% recorded in 1Q. This marked the lowest growth rate since covid (4Q2022). Retail sales rose just 0.2% in 2Q, also the slowest pace since covid. Investments weakened sharply, declining 11% in 2Q compared to a 5.7% drop in 1H. Exports remained the only bright spot, +20% in 2Q and contributing to around 20% of GDP growth.
- “Stimulus” limited to capital markets and high-tech. July’s Politburo meeting did not deliver any new stimulus, and the market reaction was muted given low expectations. Worth noting, however, is the high-profile return of China’s “National Team” (state-backed financial institutions) as a buyer of domestic equities (A-shares). These entities together bought RMB 60bn (~USD 8.9bn) of equities in a single week in July, including RMB 50bn via China Reform and RMB 10bn via China Chengtong. Significance:
o With a struggling real estate market and weakening domestic demand, one would expect China to prioritize support for the real economy (rather than capital markets). This is a bit surprising.
o This is not a conventional stimulus, yet it shows the government’s focus may be shifting towards capital market intervention – which was rarely used as a stand-alone tool. It raises the intriguing possibility that China would adopt something similar to Japan's QE (as part of Abenomics). Note Japan's QE playbook has in part led to a decade-long bull market in Japanese equities.
o The National Team normally buy SOEs and large cap stocks only. However, the latest round of buying has broadened to private, high-tech firms, i.e. the STAR 50 ETF (588000.SH). This reinforces China’s overwhelming focus on technological self-sufficiency and innovation-led growth. Tech is unlikely to rescue the Chinese economy in the near term, yet it carries significant strategic importance for China, especially under our theme of the US-China AI Race.
Source: UOB Kay Hian and Bloomberg. As of July 31, 2026.
- Our China Stock Model Portfolio gained 2.8% in July, underperforming the MSCI China ETF (MCHI). The portfolio was down 3.5% YTD, outperforming MCHI’s 5.8% decline.
- Cash dropped to 21.1% at July-end from 23.0% in June, reflecting net buying during the month. We fully exited Xiaomi (1810.HK), bought Midea (0300.HK) and ABC (1288.HK) as new positions, added to Trip.com (9961.HK) and GigaDevice (3986.HK), and trimmed Tencent (0700.HK).
- Top 3 performers: 9988.HK +26.0%, 2899.HK +23.1% and 0300.HK +20.3%.
- Bottom 3 performers: 3986.HK -61.4%, 688008.SH -33.4% and TSM -15.4%.
- HSBC (0005.HK) delivered a modest operating beat in 2Q2026, with revenue excluding notable items of USD 19.1bn (+8% yoy), underlying PBT of USD 10.3bn (+13%) and Banking NII of USD 11.6bn (+9%), ahead of consensus by around 2%, 5% and 1%, respectively. The quality of the beat was supported by a 21% yoy increase in Wealth income and an improvement in CoR to 41 bps. However, the USD 1bn buyback was below its historical quarterly range of USD 2-3bn, despite CET1 of 14.1% (within the target range of 14-14.5%). Banking NII guidance was raised to “at least USD 46bn”, while the medium-term RoTE target was unchanged. We retain HSBC as a Core Recommendation for its resilient Banking NII, strong Asian wealth momentum and sustainable RoTE of at least 17%. However, its current valuation (3.6% dividend yield) does not seem very attractive.
- CATL (300750.SZ, 3750.HK) reported strong yet in-line 1H2026 results, with revenue up 54.8% yoy to RMB 276.9bn and attributable net profit up 42.0% to RMB 43.3bn. Robust battery shipments, management's strong demand outlook for 2H2026 and 2027, and continued expansion in energy storage and overseas markets remain key growth engines. Raw-material inflation and product mix may pressure unit profitability, but scale and global expansion should support longer-term earnings resilience. We maintain CATL as a Core Recommendation for its technology leadership, dominant market position and diversified growth across power batteries, energy storage and overseas markets. Its proposed RMB 20-40bn A-share buyback should act as a stock catalyst.
- Midea (000333.SZ, 0300.HK) recently replaced Haier as our new Core Recommendation. Both companies pass our ROIC-based True Defensive Screen, but Midea offers faster revenue growth, structurally higher margins and steadier ROICs, supported by more diversified growth drivers beyond just home appliances. In 2025, Midea’s overseas sales reached RMB 195.9bn, +15.9% yoy, while commercial and industrial solutions generated RMB 122.8bn, +17.5% yoy. Near-term domestic pressure should ease in 2H2026, while overseas orders have risen around 20% since April as PortaSplit gains strong traction in Europe. Midea's stronger net cash position, global OBM upgrade opportunity, and expanding KUKA (robotics), building-technology and new-energy businesses underpin a higher-quality and more resilient growth model than Haier.
- Haier Smart Home (600690.SH / 6690.HK) was downgraded from Core Recommendation to Trading Buy, not because of any negative change in fundamentals but reflecting our clear preference for Midea (see above). Haier remains a solid global appliance company, supported by strong brands, meaningful overseas scale, recent operating momentum, a lower valuation and a higher dividend yield (than Midea). However, its revenue growth is slower and margins remain structurally below Midea's, while the expected profit recovery depends on successful European restructuring, tighter domestic expense discipline and stronger North American operations.
- Both Midea and Haier fit squarely within our core China themes this year: China Export Shock 2.0 and China Maxxing, with a series of thought-leadership pieces already published. Please visit our research website or contact your UOB Kay Hian representative for more information.
- Must watch events in August: Geely Jul Monthly Sales (Aug 2), China Jul Exports (Aug 7), Montage IPO lockup expiry (Aug 8), China Jul CPI / PPI (Aug 9), TSMC Jul Monthly Sales (Aug 10), China Jul M2 Money Supply, New Yuan Loans, Outstanding Loan Growth and Total Social Financing (Aug 13), China 2Q GDP, Jul House Price Index, Retail Sales, Industrial Production, Fixed Asset Investment (YTD), Unemployment Rate (Aug 17), China Jul Industrial Profits (Aug 27), China Jul NBS PMI & China’s Top 100 Developer Real Estate Sales (Aug 31). Earnings: HSBC (Aug 4), Tencent & Galaxy (Aug 12), China Mobile (Aug 13), Weichai Power & PetroChina (Aug 14) est, Geely (Aug 17), GigaDevice (Aug 18), Zijin (Aug 21), CNOOC (Aug 27) est, Trip.com & Innovent (Aug 27) est, Alibaba & Haier (Aug 28) est, Montage (Aug 31) est. For more information, please see Appendix B.
Fixed Income
Below is the CIO Summary from our latest Fixed Income Monthly (Aug 6, 2026), for Professional / Accredited Investors only. Ping benjamintan@uobkh.com if you’d like to receive the full report.
- Short-term: everyone has a view, no one knows for sure. Fed Chair Kevin Warsh's intentional ambiguity in rate decisions will keep markets guessing - and swinging sharply between our "false hawkishness" and "false dovishness". Our own educated guess still points to a first rate hike in December, while acknowledging the extreme uncertainty ahead.
- Longer-term: beyond just rates. The real game-changer lies in Warsh's structural reform agenda, signified by his recent launch of five task forces to overhaul the Fed policy framework. This could deliver tangible results as early as the end of 2026.
- AI's broadening market impact. The narrative on AI's impact on fixed income is rapidly evolving from corporate credit into a paradigm shift at the macro level. The AI Credit Supercycle is now exerting upward pressure on the entire yield curve.
- It may all work out in the end. We see an emerging risk of a self-reinforcing vicious cycle, where heavy AI-related debt issuance widens spreads, raises borrowing costs, and forces even more debt issuance. However, this risk could be mitigated by Fed Chair Warsh's belief in AI's positive macro potential - provided that AI ultimately delivers the impact that he expects.
- Core Recommendation: remains on high-quality, investment-grade (IG) bonds with short durations (< 3 years).
Commodities
- Gold breaks higher despite elevated real yields. Gold broke out of its one-month consolidation range on August 5, closing at USD 4,246.82/oz. The technical bias has turned positive, with potential near-term upside at USD 4,393/oz and USD 4,511/oz. On the downside, USD 4,200/oz is the first near-term support and USD 4,000/oz remains a crucial support level.
- Central-bank demand provides fundamental, longer-term support for gold. Purchases rebounded to 289 tonnes in 2Q2026 from a revised 57 tonnes in 1Q2026, taking 1H2026 buying to about 346 tonnes. The World Gold Council’s June survey showed that 89% of central banks expect global gold reserves to increase over the next 12 months and a record 45% of them plan to raise holdings. China’s steady accumulation of gold alongside a longer-term decline in its US Treasury holdings also reinforce gold as a top beneficiary of De-dollarising. (See chart below)
- Investors seeking exposure to gold can consider Gold ETF (2840.HK) or SPDR Gold Shares (GLD) for physical bullion exposure – both of which are our Core Recommendations.
Short-term Trading Range for Gold
Currencies
We rely on our associate UOB for currency views. Below are the latest insights from its Monthly FX Rates Strategy (August 4, 2026). Please refer to Appendix E for UOB’s official forecasts on FX, interest rates and commodities. You can also access the full selection of UOB research on its research portal.
Major FX & Rates Strategy: Warsh uncertainty pushes US Treasuries Yields even higher
- By now it has become abundantly clear that Fed Chairman Kevin Warsh is not a fan of forward guidance. Will Warsh be able to convince investors to embrace his leaner style of communication and much reduced forward guidance?
- However, the concurrent further rise in longer dated US Treasuries yield coupled with renewed USD weakness is a classic sign of increasing investors distrust in the Fed’s monetary policy. The recent inability of the USD to benefit from the higher US Treasuries yields is yet another sign of increasing worries about Fed credibility.
- The disconnect between geopolitical escalation and FX market response over the past month is worth noting. Despite the ceasefire collapse and a near-USD 30/bbl surge in Brent, the USD failed to attract meaningful safe-haven demand. This contrasts with the early stages of the US-Iran conflict in Mar, when geopolitical risk premia provided a clear and durable USD tailwind. In its place, monetary policy differentials have re-emerged as the primary driver of USD direction in 2H26 — consistent with our existing FX framework.
- We keep to our medium-term bearish USD bias. This is anchored on our expectation of an extended Fed rate pause through the remainder of 2026, with easing resuming across 2027 as the transitory component of inflation fades. The resulting compression in US rate differentials will be the dominant medium-term force against the USD. The DXY is expected to hold firm relative to G-10 peers through 3Q26 before resuming a gradual weakening trend thereafter to 96.9 in 2Q27.
- A compression of the US rate advantage remains the primary catalyst for a resumption of regional portfolio inflows and Asia FX appreciation from 4Q26. But ceasefire collapse, Brent's brief breach of USD 100/bbl, and the hawkish dissent at the Jul FOMC have collectively weakened, but not derailed, this base case. The primary upside risk to the USD — and downside risk to Asia FX — remains a scenario in which the Fed follows through on the hike path currently priced by swap markets.
- SGD's resilience is now underpinned by both a more hawkish MAS and a stronger growth trajectory — a combination that distinguishes it from most regional peers facing the dual headwind of oil-driven inflation and slowing activity. We therefore expect more SGD strength to 1.25 against the USD in 2Q27.
- In line with our macroeconomics team view of Fed easing across 2027, we see 3M compounded-in-arrears SOFR easing further to 3.47% in 2Q27. But in the back end, we see additional upside risks to UST yields, especially from increased fiscal supply and an unclear Fed commitment to bringing inflation down, as such 10Y UST yield may stay elevated at 4.8% in 2Q27.
We reiterate our view of a stable but gradually rising SORA and project 3M compounded-in-arrears SORA at 1.62% in 2Q27. In fact, we have observed firmer loan growth, thereby increasing demand for funding and contributing to upside pressure on SORA. Similarly, 10Y SGS yield is expected to climb further to 2.75% in 2Q27.
Appendix A: Our Top Five Predictions for 2026
Appendix B: Must Watch Events for August 2026
Date | Macro Data | Sector / Company Events |
Aug 1 | Macau Jul Casino Revenue |
|
Aug 2 |
| Geely, BYD Jul Sales |
Aug 3 | China Jun RatingDog PMI-Mfg, S&P Jul PMI-Mfg Final | Earnings: PLTR, WuXi AppTec (2359.HK) |
Aug 4 | US Jun Exports & Imports | Ai4 Conference Las Vegas (till Aug 6) Earnings: HSBC (0005.HK), SPCX, AMD, BKNG, CAT, MCD, MRK |
Aug 5 | China Jul RatingDog PMI-Svcs, S&P Jul PMI-Svcs Final | Earnings: LLY, APP, SNDK, OXY, DIS |
Aug 6 | US Initial Jobless Claims | Unitree IPO Pricing. Earnings: COP, DBS |
Aug 7 | China Jul Exports, FX Reserves, Taiwan Jul Exports, US Jul Labor Data (NFP) | Earnings: Cambricon (688256.SH), UOB, OCBC |
Aug 8 |
| Montage (6809.HK) IPO lockup expires. Earnings: BRK/B |
Aug 9 | China Jul CPI/PPI |
|
Aug 10 |
| TSMC July Monthly Sales, Unitree IPO Subscription Date |
Aug 11 |
| Earnings: LITE |
Aug 12 | US Jul CPI | Earnings: Tencent (0700.HK), Galaxy (0027.HK), Unicom (0762.HK) |
Aug 13 | US Jul PPI, China Jul M2 Money Supply, New Yuan Loans, Outstanding Loan Growth, Total Social Financing, Initial Jobless Claims
对话 CIO 系列私享会 #11:韓國豪賭歐亞算力,中美AI 競賽正酣7:30-8:30PM | Earnings: AMAT, China Mobile (0941.HK), SMIC (0981.HK), JD.com (9618.HK), Lenovo (0992.HK) |
Aug 14 | US Jul Retail Sales | Earnings: PetroChina (0857.HK) est, Weichai Power (000338.SZ) est, Agricultural Bank of China (1288.HK) est, Meituan (3690.HK) est, China Shenhua Energy (1088.HK) est, BYD (1211.HK) est, CGN Power (1816.HK) est, Sinopec (0386.HK) est, Kweichow Moutai (600519.SH), Great Wall Motor (601633.SH) est, MTR (0066.HK) est, China Telecom (0728.HK) est, CCB (0939.HK) est |
Aug 17 | China Jul Retail Sales, Industrial Production, Fixed Asset Investment (YTD), Unemployment rate, US May House Price Index
| Unitree IPO Listing est (till Aug 19) Earnings: Geely (0175.HK) |
Aug 18 | English CIO Series #38: Asia's AI Moment - What Investors Need to Know 6:30-7:30PM https://events.teams.microsoft.com/event/f847c65f-82ed-4182-89c5-e7f74f5a96d6@7eadc1e1-1a4d-4f70-9305-931a048687ff | Earnings: HD, BHP |
Aug 19 |
| Earnings: TJX, CR Beer (0291.HK) |
Aug 20 | FOMC Jul Minutes, US Initial Jobless Claims | Gamescom 2026 (till Aug 24) Earnings: WMT, Ping An (2318.HK), Chongqing Machinery (2722.HK) |
Aug 21 | S&P Global PMI-Mfg & Svcs Flash. CIO Series Luncheon (Hong Kong): US Market Outlook with Nasdaq. 12:00-2:30PM (In-person event)
| Earnings: Zijin (2899.HK) |
Aug 25 | CIO Series Forum (Singapore): Macro Shocks vs. AI Tailwinds. 5:30-7:00PM (In-person event)
| Earnings: Luxshare (002475.SZ) |
Aug 26 | US 2Q GDP, US Jul Personal Income/Spending, US Jul PCE | Earnings: NVDA, Gree Electric (000651.SZ), Anta (2020.HK) |
Aug 27 | US Jackson Hole Symposium (till Aug 29), US Initial Jobless Claims, China Jul Industrial Profits (YTD) | Earnings: MRVL est, CNOOC (0883.HK) est, Innovent (1801.HK) est, Trip.com (9961.HK) est, China Overseas Land (0688.HK) est, |
Aug 28 |
| Earnings: Haier (6690.HK) est, Alibaba (9988.HK) est, CR Land (1109.HK), Li Auto (2015.HK) est. |
Aug 29 |
| Earnings: ICBC (1398.HK) est |
Aug 31 | China Jul NBS PMI | China Jul NBS PMI & China’s Top 100 Developer Real Estate Sales. |
Appendix C: Global ETF Toolkit Highlights
Appendix D: Roadmap to Private Wealth Management Research
Note: Report lengths are approximate and may vary. Please contact research@uobkh.com if you’d like to subscribe to any research above.
Be sure to subscribe to our Wealth Vision YouTube channel, including replays of our CIO Series and much more.
https://www.youtube.com/@uobkh_wealthvision
Appendix E: UOB FX, Interest Rates & Commodities Forecasts
Source: UOB Research, Bloomberg (Updated as of 4 August 2026)
* Forecasts updated as compared to previous report dated 02 July 2026
Disclosures and disclaimers
This report is provided subject to, and must be read together with, the full Disclosures / Disclaimers available at this link, which are incorporated by reference into this report. In particular, this report is intended for general circulation and informational purposes only and does not constitute personal investment advice or a recommendation to buy or sell any investment product or security. You should independently evaluate the information and, where necessary, seek advice from a qualified financial adviser regarding the suitability of any investment. Analyst certifications required under applicable regulations, including SEC Regulation AC (where relevant), are included in this report. By accessing, receiving or using this report, you acknowledge that you have read, understood and agreed to be bound by the Disclosures / Disclaimers, as may be amended, supplemented or updated from time to time.


