

Analyst
Wendy Chen
wendy.chen@uobkh.comAnalyst
Wang Qi, CFA
qi.wang@uobkh.comAnalyst
In collaboration with UOBKH Institutional Research
Key US Market Indices
Index | Price | Past 2-Week Return | YTD Price Return |
S&P 500 | 7,562 | 0.3% | 10.5% |
Dow Jones Industrial Average | 52,348 | 0.7% | 8.9% |
Nasdaq Composite | 25,136 | -0.1% | 8.2% |
Source: UOB Kay Hian and iFinD, as of November 13, 2026.
- The November "information blast": Midterms, inflation, and the fall of a bellwether. November has been an unprecedented information blast, with market narratives and sector rotations shifting on a daily basis. Three seismic events dominated the tape:
- The Midterms "Blue Sweep": While Democrats winning both houses was expected with 70+% probability, the surprise came from the governor level with key datacenter states (e.g. Texas) flipped blue. The political shockwave migrated from ballot box to trading tape: S&P 500 initially rallied 1.6% on Nov 4th as uncertainty landed, followed by a self-reinforcing liquidation loop on Nov 5th, as leveraged ETF rebalancing amplified the mechanical selling and equity decline.
- Hot CPI locks in the December hike: US core CPI landed at +0.3% MoM as FOMC member Waller had warned, with inflation broadening beyond the energy realm. Consequently, FedWatch now fully prices a December rate hike, with <10% tail risk of an aggressive 50bps step. The 10-year Treasury yield surged back above 5.1%, validating our persistent "higher-for-longer" thesis.
- The swift ouster of Jensen Huang: In a stunning turn of events, Nvidia, the bellwether stock of the AI era is at the epicenter of debate. This sudden leadership vacuum and the associated governance anxieties have sent shockwaves through the AI supply chain, forcing reassessment of the "key-man risk" and driving a hunt for alternatives, evident in the rallies of AVGO and AMD.
- The Midterms "Blue Sweep": While Democrats winning both houses was expected with 70+% probability, the surprise came from the governor level with key datacenter states (e.g. Texas) flipped blue. The political shockwave migrated from ballot box to trading tape: S&P 500 initially rallied 1.6% on Nov 4th as uncertainty landed, followed by a self-reinforcing liquidation loop on Nov 5th, as leveraged ETF rebalancing amplified the mechanical selling and equity decline.
- Market performance: Amid the whipsaw macro and AI crosscurrents, US equities posted a surprisingly resilient performance over the past two weeks. The Dow Jones (+0.7%) slightly outpaced the S&P 500 (+0.3%), while the tech-heavy Nasdaq Composite only slipped marginally (-0.1%). YTD returns remain robust (8.2% to 10.5%), demonstrating the market's underlying ability to absorb shockwaves without breaking the broader uptrend.
- Looking ahead, despite the recent turbulence, the setup for the remainder of 2026 is constructive. On the technical front, after an intense period of position cleansing and forced liquidation, near-term fund flows are poised to turn supportive. As the liquidity drain from the highly anticipated Anthropic IPO (currently 6x oversubscribed) will pass in the coming week, market flows are likely to turn more favourable. On the fundamental front, while the AI theme endured a rollercoaster ride in recent weeks, prints from TSMC and infrastructure names provide evidence that enterprise demand remains insatiable. Moreover, the US economy continues to outperform, with nominal GDP growth running above trend and unexpectedly accelerating in 2H2026, which is likely to support the sentiment and broad market uptrend.
- Must-attend: CIO Series on 2027 Top Predictions. We have successfully called all five of our top predictions for 2026, including the "Great AI Capex Cooldown". Crucially, the near-term impact of this shift is more limited than market fears—evidenced by the swift rebound in related AI stocks. What are the top five market-defining predictions for the year ahead? Join our upcoming CIO Series webcast to find out: Nov 25 in Chinese (for Mainland and Overseas) and Nov 26 in English.
- Best performing sectors: Communication Services (XLC) +8.4%, Health Care (XLV) +2.3%, Financials (XLF) +1.9%.
- Potential movers and shakers:
Positive | Broadcom (AVGO), Tesla (TSLA), Berkshire Hathaway (BRK/B), McDonald’s (MCD) |
Neutral | SpaceX (SPCX) |
Negative | Nvidia (NVDA) |
- Must Watch Events: Fed Chair speech on Productivity Task Force (Nov 16), China APEC (Nov 18-19), Anthropic IPO (Nov 19), Oct FOMC Minutes (Nov 19), Oct PCE (Nov 25), Nov NFP (Dec 3). Earnings: NVDA (Nov 17), Tencent (Nov 18), WMT/Alibaba (Nov 19), Dell (Nov 24). Details below.
Date | Macro Data | Sector / Company Events |
Nov 16 | Fed Chair speech on Productivity and Jobs Task Force Conference, US Retail Sales | Earnings: Baidu, XPEV |
Nov 17 | US Oct Capacity Utilization | Earnings: NVDA, HD, DIS, JD |
Nov 18 | China APEC Economic Leaders’ Meeting (11.18-11.19) | Morgan Stanley Asia Pacific Summit 2026 Nvidia CEO Jensen Huang House Briefing (est) Earnings: TGT, TJX, PANW, Tencent |
Nov 19 | US Initial Jobless Claims, Oct FOMC Minutes | Anthropic begins trading on Nasdaq Earnings: WMT, Alibaba, PDD |
Nov 20 | US Consumer Sentiment Final |
|
Nov 24 | US Sep House Price Index | Earnings: Dell, WDAY |
Nov 25 | US Oct PCE, US Q3 GDP (2nd Estimate) | Earnings: GDS, LI |
Nov 26 | US Initial Jobless Claims, US Oct Personal Income/Spending |
|
Nov 27 | US Black Friday, China Oct Industrial Profits (YTD) |
|
Dec 1 | US Nov ISM Manufacturing PMI, US JOLTs Job Openings, China RatingDog Manufacturing PMI | Earnings: MRVL, CRWD |
Dec 2 |
| Earnings: CRM, SNOW |
Dec 3 | US Nov ISM Services PMI, US Initial Jobless Claims | Earnings: DG, KR, ULTA |
Dec 4 | US Nov Unemployment Rate, US Nov Nonfarm Payrolls |
|
Best 3 S&P Sectors (Past 2 Weeks)
Sector ETF | Past 2-Week Return | YTD Return | Stock Drivers Past 2-Weeks |
Communication Services | 8.4% | -6.8% | The Walt Disney Company (DIS.N) +5.2%, Omnicom Group Inc. (OMC.N) +4.8%, AT&T Inc. (T.N) +3.5% |
Health Care | 2.3% | 23.5% | Johnson & Johnson (JNJ.N) +5.6%, Eli Lilly And Company (LLY.N) +2.4%, McKesson Corporation (MCK.N) +10.5% |
Financials | 1.9% | 8.4% | Berkshire Hathaway Inc. (BRK.B.N) +6.6%, JPMorgan Chase & Co. (JPM.N) +1.6%, Bank of America Corp (BAC.N) +2.9% |
Source: UOB Kay Hian and iFinD, as of November 13, 2026.
- Communication Services staged a sharp rebound with XLC surged 8.4% over the past two weeks, easily claiming the top spot and significantly narrowing its YTD decline to 6.8%. The sector's turnaround was highly diversified. Walt Disney (DIS) advanced 5.2%, continuing to capitalize on its successful streaming price hikes since September, and expanding live sports content. Omnicom Group (OMC) gained 4.8%, signaling that corporate advertising spend remains surprisingly resilient despite macro anxieties. Legacy telecom heavyweight AT&T (T) rallied 3.5%, staging a tactical relief rally after being severely oversold in the previous 2 months. This broad-based strength suggests investors are looking past near-term rate sensitivities and refocusing on the sector's improving free cash flow profiles.
- Health Care extends its stellar YTD run as the ultimate growth compounder outside the AI realm. Health Care (XLV) added a steady 2.3%, pushing its outstanding YTD return to a sector-leading 23.5%. As the market braces for the midterm election gauntlet and lingering Fed policy uncertainties, capital continues to rotate into XLV's unique blend of counter-cyclical stability and structural growth. Johnson & Johnson (JNJ) led the mega-caps with a 5.6% gain, supported by its resilient MedTech segment and robust pharmaceutical pipeline. Eli Lilly (LLY) added another 2.4%, reflecting sustained investor confidence in its dominant GLP-1 franchise and ongoing manufacturing expansions. Notably, healthcare distributor McKesson (MCK) surged 10.5%, highlighting the sentiment lift in the healthcare accessibility sector amid a sweeping Democratic win in the midterms. JNJ and LLY remain our Core Recommendations and have been outperforming the broader market since we initiated earlier this year, XLV remains our Trading Buy.
- Financials recover from recent rate-shock fears, anchored by Berkshire's fortress balance sheet. Financials (XLF) edged up 1.9%, bringing its YTD return to a solid 8.4% and shaking off the severe "AI disruption" and investment banking fears that weighed on the sector in the previous period. The rally was spearheaded by Berkshire Hathaway (BRK.B), which surged 6.6%. In a volatile macro environment with ongoing AI debate and rate hike worries, BRK's massive cash reserves and diversified earnings act as the ultimate defensive shelter. Major banks also found their footing, with Bank of America (BAC) gaining 2.9% and JPMorgan Chase (JPM) adding 1.6%, as the market reassured itself that resilient net interest margins and strong capital positions can offset near-term capital markets softness. BRK/B remains our Core Recommendation.
Worst 3 S&P Sectors (Past 2 Weeks)
Sector ETF | Past 2-Week Return | YTD Return | Stock Drivers Past 2-Weeks |
Information Technology | -2.3% | 18.7% | Dell Technologies Inc. (DELL.N) -12.3%, Corning Incorporated (GLW.N) -7.2%, Salesforce Inc. (CRM.N) -3.7% |
Materials | -2.7% | 16.7% | Corteva, Inc. (CTVA.N) -20.9%, Nucor Corporation (NUE.N) -9.3%, International Flavors & Fragrances Inc. (IFF.N) -14.2% |
Energy | -3.4% | 48.2% | ExxonMobil Holdings Corporation (XOM.N) -5.1%, Chevron Corporation (CVX.N) -3.5%, ConocoPhillips (COP.N) -3.1% |
Source: UOB Kay Hian and iFinD, as of November 13, 2026.
- Information Technology feels the bite of the "AI capex cooldown" and key person risk debate. Info Tech (XLK) retreated 2.3% over the past two weeks, pulling back from its recent highs and moderating its YTD advance to 18.7%. The decline perfectly illustrates the ongoing "sorting mechanism" within the AI trade, where investors ruthlessly differentiate between proven infrastructure winners and laggards facing execution risks. Dell Technologies (DELL) slumped 12.3% amid midterms triggered concerns over datacenter demand and continued pressure on PC demand. Optical networking name Corning (GLW) also retreated 7.2% as investors worry about a datacenter buildout slowdown. Enterprise software bellwether Salesforce (CRM) dipped 3.7% as the market demands clearer proof of SaaS monetization amid agentic AI challenges. Despite the near-term turbulence, the sector's robust YTD performance underscores the secular AI tailwind even as the market shifts from broad momentum to fundamental scrutiny.
- Materials retreats on idiosyncratic shocks and industrial cyclicality. Materials (XLB) declined 2.7%, trimming its YTD gain to 16.7% as the sector faced a toxic mix of stock-specific collapses and broader macro headwinds. Agricultural seed company Corteva (CTVA) plummeted 20.9%, while International Flavors & Fragrances (IFF) tumbled 14.2%, reflecting deepening anxieties over global crop pricing, inventory destocking, and softer consumer demand for specialty ingredients. Meanwhile, steelmaker Nucor (NUE) fell 9.3%, acting as a barometer for the sector's lingering sensitivity to "higher-for-longer" interest rates, which continue to suppress domestic construction and manufacturing activity. The sector remains highly dependent on stabilization in global industrial PMIs and a pivot in Fed policy.
- Energy undergoes profit-taking after a stellar YTD run, but structural hedges remain. Energy (XLE) slipped 3.4% over the past two weeks, marking a normal consolidation phase for the market's top YTD performer, which still boasts a massive 48.2% advance. The broad-based pullback saw integrated majors ExxonMobil (XOM) and Chevron (CVX) retreat 5.1% and 3.5%, respectively, while independent producer ConocoPhillips (COP) dipped 3.1%. This tactical de-risking was driven by near-term softness in crude prices as the blue-sweep in midterms raises hope for a diplomatic solution for the prolonged US-Iran nexus. However, with the sector's cash flow generation remaining exceptionally robust and its role as a premier portfolio hedge against sticky inflation and geopolitical tail risks fully intact, we maintain XLE as our Core Recommendation.
Stocks: Potential Movers and Shakers
Please note that not all stocks mentioned below are recommended by PWM Research / CIO Office. Please refer to the Appendix for our US Stock Model Portfolio and official recommendations. Equity investing involves significant risk. Investor discretion is advised.
Stock | Sector | PWM Research Recommendation | Type of News | Our Read on the News |
Broadcom (AVGO) | Information Technology | Core Recommendation | Channel Checks | Positive |
- Anthropic (ANT) has launched its IPO roadshow, with the indicated price implying a fully diluted valuation of approximately US$1.4tn. Anthropic's compute commitments now total roughly US$900bn through 2045, with Broadcom serving as one of its key TPU suppliers.
- Separately, Google (GOOGL) announced an expansion of its eighth-generation TPU portfolio, introducing TPU 8i Max and TPU 8tx. The new TPU 8i Max appears to roughly double the TPU 8i content (co-developed with Broadcom) within a single package and is expected to begin ramping in 2H27. Recent industry reports suggest that TPU v9 has encountered design-related delays (to 2028). As a result, Google appears to be expanding deployment of Broadcom's TPU 8i as a backup solution while TPU v9 is pushed back or cancelled.
- We believe Broadcom is well-positioned to outperform, supported by several increasingly favorable developments. First, Anthropic has significantly strengthened its funding position, reducing concerns about its ability to finance future compute purchases. Second, fears of TPU market-share loss to MediaTek are beginning to ease as Google expands deals with Broadcom (~40% of Broadcom revenue). Third, leadership uncertainty at Nvidia could create an additional opportunity for Broadcom to gain market shares (Nvidia ~60% vs Broadcom ~20%).
Stock | Sector | PWM Research Recommendation | Type of News | Our Read on the News |
Nvidia (NVDA) | Information Technology | Core Recommendation | Earnings | Negative |
- Nvidia (NVDA) has fallen more than 20%-30% from its peak as the Jensen Huang situation escalated. Although Jensen Huang has resigned, The Financial Times recently reported that he has discussed the possibility of returning.
- We acknowledge the significant key-man risk, as Huang's vision and execution have been central to Nvidia's success. Under Jensen's leadership, Nvidia repeatedly demonstrated the ability to identify major technology inflection points, commit resources decisively, and execute rapidly across its supply chain.
- Over the medium to long term, investors must also consider the risk of organizational change. A new leadership team may alter Nvidia's strategic priorities, and it remains unclear whether the company can continue making the right technology bets that have driven its success over the past decade.
- We will likely need 2-3 quarters to properly assess the capabilities and strategic direction of the new management team. Given the current uncertainty surrounding leadership, we believe the stock is unlikely to revisit its previous highs (~US$240) in the near term.
- Nvidia will report earnings on November 17 (US Time), we expect another strong quarter despite Rubin shipments slower than expectations due to HBM delays. There will be tons of questions post Jensen Huang’s resignation, but key investor focus will be on whether memory price pressure on margin, whether CSPs are slowing down buildout as Democrats won the mid-term election, and how Nvidia will deal with Neocloud financing.
Stock | Sector | PWM Research Recommendation | Type of News | Our Read on the News |
Berkshire Hathaway Class B (BRK/B) | Multiple Industries | Core Recommendation | Earnings | Positive |
- Non-insurance businesses shone. Berkshire Hathaway (BRK) reported 3Q26 operating earnings of US$12.7b, down 5.8% yoy, as weaker insurance results weighed on growth across its other major businesses. Insurance underwriting earnings fell 42.9% to US$1.35b, while insurance investment income declined 14.1% to US$2.7b. BNSF’s earnings increased 19.3% to US$1.7b, Berkshire Hathaway Energy’s rose 8.3% to US$1.6b, and manufacturing, service and retailing earnings grew 11.8% to US$4.0b. Net earnings attributable to shareholders declined 28.2% to US$22.1b, or US$10.33 per Class B share.
- Stepped up capital returns. BRK repurchased US$9.7b of shares during the quarter, compared with US$4.5b in 2Q26, bringing 9M26 buybacks to US$14.4b. Shareholders’ equity reached US$761b as of Sep 26, up 6.1% from end-25. BRK's cash and treasury holdings remain huge at US$373b as of Sep 26, representing an increase of US$4b ytd. Overall, the results showed continued growth across BRK’s non-insurance businesses. Net earnings rose 21.2% yoy to US$57.9b in 9M26.
- Defensive shelter from market volatility. BRK/B trades at a 2026 PE of 26.4x and P/B of 1.66x. BUY BRK due to its diversified earnings and cash-rich balance sheet. (Jonathan Koh)
Stock | Sector | PWM Research Recommendation | Type of News | Our Read on the News |
Tesla (TSLA US) | Consumer Discretionary | No Recommendation | Sales / Products, Corporate Action | Positive |
- Tesla’s China retail sales fell 66.1% yoy to 8,817 units in October, the lowest since July 2022, while exports made up 87% of the 67,829 units its Shanghai plant shipped. On 6 November, Elon Musk said Tesla will wind down Cybertruck production in Texas to make room for the Cybercab, and later extended output to the end of summer 2027. Cox Automotive estimates US Cybertruck sales at 20,237 units in 2025.
- On 12 November, Bloomberg reported that Tesla and SpaceX are negotiating price and control in a merger that could be announced as soon as December. Tesla launched Robotaxi in San Antonio on 9 November, and Finland approved its driver-assistance system.
- We see the SpaceX merger, not car sales, as the stock’s main driver, and its terms decide what Tesla holders own. Tesla is losing market share in China: its retail sales there fell 66.1% yoy in October, nearly five times the 13.7% yoy decline in China’s overall NEV retail sales in the same month. Exports, 87% of Shanghai’s October shipments, will also lose support when China cuts the EV export VAT rebate to 9% from 13% in April 2027. The Cybertruck was about 1% of 2025 deliveries. Key triggers to watch: the 3 December shareholder meeting, a merger announcement and November China sales. (Ken Lee)
Stock | Sector | PWM Research Recommendation | Type of News | Our Read on the News |
SpaceX (SPCX US) | Communication Services | No Recommendation | Channel Checks / Corporate Action | Neutral |
- SpaceX’s Starship Flight 15 successfully reached orbit, spending approximately 22.5 hours from liftoff to its return toward Starbase and completing 14 orbits around Earth. This marks the longest orbital flight for the vehicle to date. Although the spacecraft adjusted its trajectory and ultimately landed in the ocean, the mission provided critical positive proof points for the company's rapid reusability goals. Notably, engine performance showed marked improvement during the launch and initial ascent phase, reinforcing the continued iteration and execution of Starship hardware and software.
- Massive capacity unlocks for Starlink and future compute. The flight successfully deployed 26 operational Starlink V3 satellites, driving significant capacity unlocks. From a mass-to-orbit and satellite generation perspective, each of the last two Starship flights has deployed roughly 10 Falcon 9 launches' worth of capacity. This positions Starship as a key vehicle to scale SpaceX’s connectivity business and, longer-term, supports the company's ambitions to scale orbital compute capacity as it builds out its super intelligence infrastructure.
- Balanced outlook amid technical and corporate overhangs. While Flight 15 provides positive proof points for Starship's reusability and long-term capacity scaling, near-term sentiment is likely to be capped by idiosyncratic headwinds. We are mindful of technical headwinds with large lock-up expiries in December 2026 and June 2027. Furthermore, speculative chatter regarding a potential M&A with Tesla introduces additional valuation complexity and uncertainty for investors, balancing SPCX’s long-term structural advantages against these immediate supply and corporate risks. (Wendy Chen)
Stock | Sector | PWM Research Recommendation | Type of News | Our Read on the News |
McDonald’s (MCD US) | Consumer Discretionary | No Recommendation | Earnings | Positive |
- 3Q26 EPS beat consensus by 6%, while revenue missed by 2%. McDonald’s 3Q26 global comparable sales rose 1.5% yoy. Consolidated revenue reached US$7.16b, up 1% yoy in constant currencies (same for the following yoy), but 2% below consensus. System-wide sales rose 4% yoy. Operating income increased 7% yoy to US$3.6b, with operating margin expanding by 2.8ppt yoy to 50.2%. Net income rose 9% yoy to US$2.5b. Adjusted EPS was US$3.57, up 11% yoy, beating consensus by 6%.
- US comparable sales turned positive in Sep following value interventions. US comparable sales slipped 0.2% yoy in 3Q26, as negative guest counts were largely offset by higher average check. Sales improved through the quarter and turned positive in Sep, after McDonald’s restored digital offers and redirected marketing towards entry-level meal deals and Extra Value Meals. Management is encouraged by baseline traffic through Oct, but clarified that it is not guiding for better 4Q26 US comps. New entry-level bundles are being tested in about 1,900 US restaurants, with a national launch planned for early 2027.
- China remained negative, while Japan led IDL growth. In the International Developmental Licensed Markets segment (IDL), comparable sales rose 4.2% yoy, with all regions positive and Japan delivering its 44th consecutive quarter of growth. China’s comparable sales declined, weighed by a challenging macro backdrop and third-party delivery platforms pulling back on subsidies. In the International Operated Markets segment (IOM), comparable sales rose 1.4% yoy, led by Germany and Australia but offset by France. Management expects 3Q26 conditions to persist through 4Q26.
- 2026 openings target trimmed; mid-single-digit food and paper inflation expected in 2027. McDonald’s now expects about 2,500 gross restaurant openings in 2026, down from 2,600, while maintaining about 2,100 net openings. Capex is guided at about US$3.7b, the low end of the prior US$3.7-3.9b range. Management expects mid-single-digit food and paper inflation in 2027, above historical trends, which will require careful pricing to preserve value leadership.
- Quality name for long-term accumulation, but expect sideways trading after the recent run-up. Post-results, McDonald’s shares have fallen 3%, following an earlier run-up from US$231, while the consensus target price has been revised up 3% to US$299.42. Its 1-year forward PE currently stands at 20.0x, above the S&P 500’s 18.1x, but 15% below its 10-year historical average of 23.5x. While we see McDonald’s as a quality stock for long-term accumulation, we expect it to trade sideways between US$257 and US$290 in the short to mid-term. (Ejann Hiew)
Type of News | Explanation |
Channel Checks | Industry-wide or supply chain news with implications to a particular sector or company |
Corporate Action | Dividends, special dividends, stock splits, share buybacks, equity / bond financing, M&As, spin-offs and restructuring etc. |
Earnings | Quarterly earnings for US-listed companies. Semi-annual earnings for Hong Kong-listed companies |
Insider Dealing | Company insiders’ buying / selling of stocks and derivatives of the company |
Investor Action | Leading investor buying / selling including activist investor actions |
Investor Roadshow | Deal and non-deal roadshows, reverse roadshows (analyst days), and company meetings at investment conferences |
Legal / Regulatory | Lawsuits, legislature/regulation changes, other regulatory events |
Macro / Industry Data | Regular economic or industry data related to the sector or stock |
Sales / Products | Sales or product related news, such as monthly sales or new product launches |
Public Event | Public speeches and appearances by companies in the media or industry conferences |
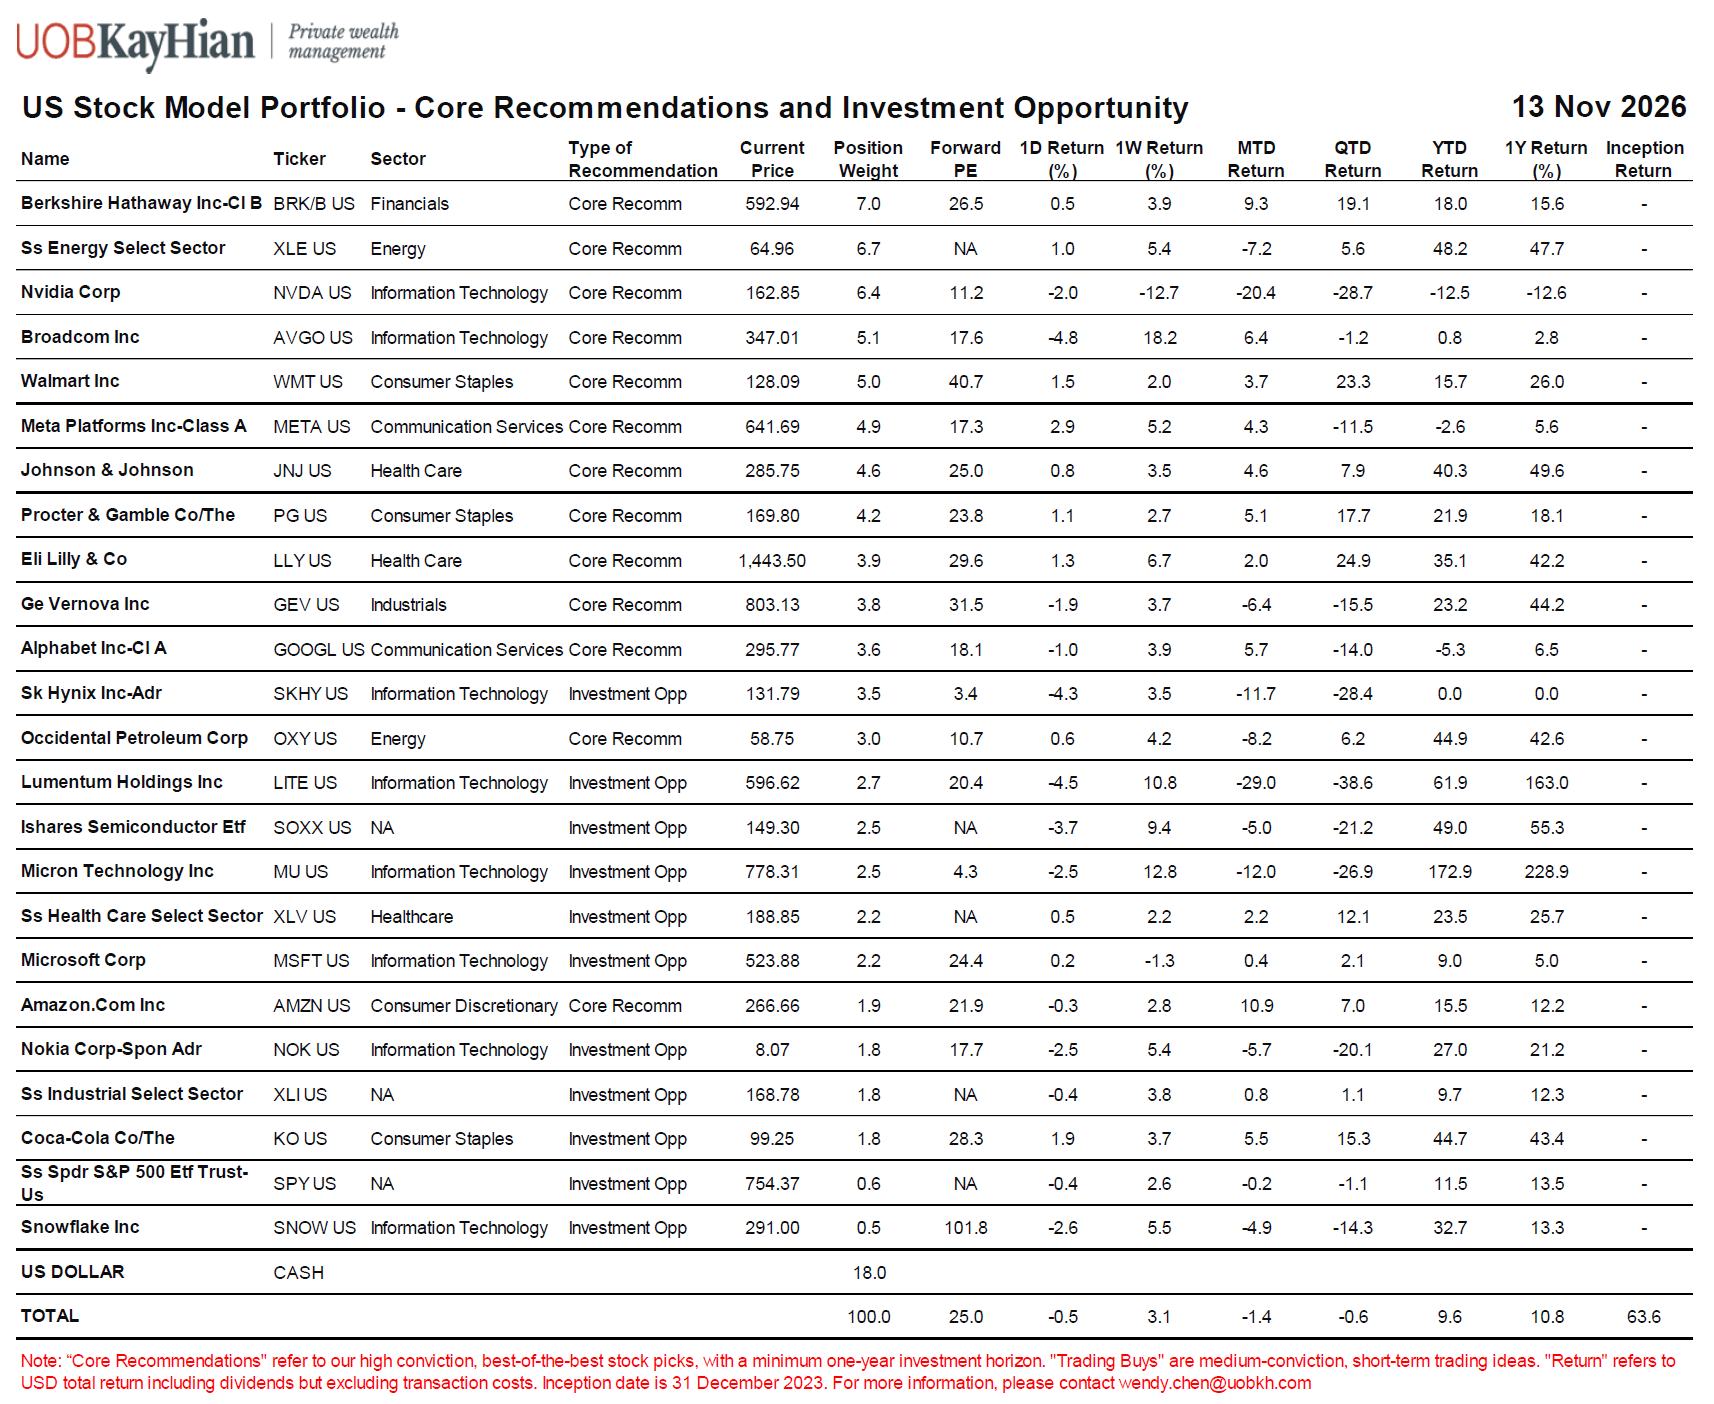
Appendix A – US Stock Model Portfolio
Key US Market Indices
Index | Price | Past 2-Week Return | YTD Price Return |
S&P 500 | 7,562 | 0.3% | 10.5% |
Dow Jones Industrial Average | 52,348 | 0.7% | 8.9% |
Nasdaq Composite | 25,136 | -0.1% | 8.2% |
Source: UOB Kay Hian and iFinD, as of November 13, 2026.
- The November "information blast": Midterms, inflation, and the fall of a bellwether. November has been an unprecedented information blast, with market narratives and sector rotations shifting on a daily basis. Three seismic events dominated the tape:
- The Midterms "Blue Sweep": While Democrats winning both houses was expected with 70+% probability, the surprise came from the governor level with key datacenter states (e.g. Texas) flipped blue. The political shockwave migrated from ballot box to trading tape: S&P 500 initially rallied 1.6% on Nov 4th as uncertainty landed, followed by a self-reinforcing liquidation loop on Nov 5th, as leveraged ETF rebalancing amplified the mechanical selling and equity decline.
- Hot CPI locks in the December hike: US core CPI landed at +0.3% MoM as FOMC member Waller had warned, with inflation broadening beyond the energy realm. Consequently, FedWatch now fully prices a December rate hike, with <10% tail risk of an aggressive 50bps step. The 10-year Treasury yield surged back above 5.1%, validating our persistent "higher-for-longer" thesis.
- The swift ouster of Jensen Huang: In a stunning turn of events, Nvidia, the bellwether stock of the AI era is at the epicenter of debate. This sudden leadership vacuum and the associated governance anxieties have sent shockwaves through the AI supply chain, forcing reassessment of the "key-man risk" and driving a hunt for alternatives, evident in the rallies of AVGO and AMD.
- The Midterms "Blue Sweep": While Democrats winning both houses was expected with 70+% probability, the surprise came from the governor level with key datacenter states (e.g. Texas) flipped blue. The political shockwave migrated from ballot box to trading tape: S&P 500 initially rallied 1.6% on Nov 4th as uncertainty landed, followed by a self-reinforcing liquidation loop on Nov 5th, as leveraged ETF rebalancing amplified the mechanical selling and equity decline.
- Market performance: Amid the whipsaw macro and AI crosscurrents, US equities posted a surprisingly resilient performance over the past two weeks. The Dow Jones (+0.7%) slightly outpaced the S&P 500 (+0.3%), while the tech-heavy Nasdaq Composite only slipped marginally (-0.1%). YTD returns remain robust (8.2% to 10.5%), demonstrating the market's underlying ability to absorb shockwaves without breaking the broader uptrend.
- Looking ahead, despite the recent turbulence, the setup for the remainder of 2026 is constructive. On the technical front, after an intense period of position cleansing and forced liquidation, near-term fund flows are poised to turn supportive. As the liquidity drain from the highly anticipated Anthropic IPO (currently 6x oversubscribed) will pass in the coming week, market flows are likely to turn more favourable. On the fundamental front, while the AI theme endured a rollercoaster ride in recent weeks, prints from TSMC and infrastructure names provide evidence that enterprise demand remains insatiable. Moreover, the US economy continues to outperform, with nominal GDP growth running above trend and unexpectedly accelerating in 2H2026, which is likely to support the sentiment and broad market uptrend.
- Must-attend: CIO Series on 2027 Top Predictions. We have successfully called all five of our top predictions for 2026, including the "Great AI Capex Cooldown". Crucially, the near-term impact of this shift is more limited than market fears—evidenced by the swift rebound in related AI stocks. What are the top five market-defining predictions for the year ahead? Join our upcoming CIO Series webcast to find out: Nov 25 in Chinese (for Mainland and Overseas) and Nov 26 in English.
- Best performing sectors: Communication Services (XLC) +8.4%, Health Care (XLV) +2.3%, Financials (XLF) +1.9%.
- Potential movers and shakers:
Positive | Broadcom (AVGO), Tesla (TSLA), Berkshire Hathaway (BRK/B), McDonald’s (MCD) |
Neutral | SpaceX (SPCX) |
Negative | Nvidia (NVDA) |
- Must Watch Events: Fed Chair speech on Productivity Task Force (Nov 16), China APEC (Nov 18-19), Anthropic IPO (Nov 19), Oct FOMC Minutes (Nov 19), Oct PCE (Nov 25), Nov NFP (Dec 3). Earnings: NVDA (Nov 17), Tencent (Nov 18), WMT/Alibaba (Nov 19), Dell (Nov 24). Details below.
Date | Macro Data | Sector / Company Events |
Nov 16 | Fed Chair speech on Productivity and Jobs Task Force Conference, US Retail Sales | Earnings: Baidu, XPEV |
Nov 17 | US Oct Capacity Utilization | Earnings: NVDA, HD, DIS, JD |
Nov 18 | China APEC Economic Leaders’ Meeting (11.18-11.19) | Morgan Stanley Asia Pacific Summit 2026 Nvidia CEO Jensen Huang House Briefing (est) Earnings: TGT, TJX, PANW, Tencent |
Nov 19 | US Initial Jobless Claims, Oct FOMC Minutes | Anthropic begins trading on Nasdaq Earnings: WMT, Alibaba, PDD |
Nov 20 | US Consumer Sentiment Final |
|
Nov 24 | US Sep House Price Index | Earnings: Dell, WDAY |
Nov 25 | US Oct PCE, US Q3 GDP (2nd Estimate) | Earnings: GDS, LI |
Nov 26 | US Initial Jobless Claims, US Oct Personal Income/Spending |
|
Nov 27 | US Black Friday, China Oct Industrial Profits (YTD) |
|
Dec 1 | US Nov ISM Manufacturing PMI, US JOLTs Job Openings, China RatingDog Manufacturing PMI | Earnings: MRVL, CRWD |
Dec 2 |
| Earnings: CRM, SNOW |
Dec 3 | US Nov ISM Services PMI, US Initial Jobless Claims | Earnings: DG, KR, ULTA |
Dec 4 | US Nov Unemployment Rate, US Nov Nonfarm Payrolls |
|
Best 3 S&P Sectors (Past 2 Weeks)
Sector ETF | Past 2-Week Return | YTD Return | Stock Drivers Past 2-Weeks |
Communication Services | 8.4% | -6.8% | The Walt Disney Company (DIS.N) +5.2%, Omnicom Group Inc. (OMC.N) +4.8%, AT&T Inc. (T.N) +3.5% |
Health Care | 2.3% | 23.5% | Johnson & Johnson (JNJ.N) +5.6%, Eli Lilly And Company (LLY.N) +2.4%, McKesson Corporation (MCK.N) +10.5% |
Financials | 1.9% | 8.4% | Berkshire Hathaway Inc. (BRK.B.N) +6.6%, JPMorgan Chase & Co. (JPM.N) +1.6%, Bank of America Corp (BAC.N) +2.9% |
Source: UOB Kay Hian and iFinD, as of November 13, 2026.
- Communication Services staged a sharp rebound with XLC surged 8.4% over the past two weeks, easily claiming the top spot and significantly narrowing its YTD decline to 6.8%. The sector's turnaround was highly diversified. Walt Disney (DIS) advanced 5.2%, continuing to capitalize on its successful streaming price hikes since September, and expanding live sports content. Omnicom Group (OMC) gained 4.8%, signaling that corporate advertising spend remains surprisingly resilient despite macro anxieties. Legacy telecom heavyweight AT&T (T) rallied 3.5%, staging a tactical relief rally after being severely oversold in the previous 2 months. This broad-based strength suggests investors are looking past near-term rate sensitivities and refocusing on the sector's improving free cash flow profiles.
- Health Care extends its stellar YTD run as the ultimate growth compounder outside the AI realm. Health Care (XLV) added a steady 2.3%, pushing its outstanding YTD return to a sector-leading 23.5%. As the market braces for the midterm election gauntlet and lingering Fed policy uncertainties, capital continues to rotate into XLV's unique blend of counter-cyclical stability and structural growth. Johnson & Johnson (JNJ) led the mega-caps with a 5.6% gain, supported by its resilient MedTech segment and robust pharmaceutical pipeline. Eli Lilly (LLY) added another 2.4%, reflecting sustained investor confidence in its dominant GLP-1 franchise and ongoing manufacturing expansions. Notably, healthcare distributor McKesson (MCK) surged 10.5%, highlighting the sentiment lift in the healthcare accessibility sector amid a sweeping Democratic win in the midterms. JNJ and LLY remain our Core Recommendations and have been outperforming the broader market since we initiated earlier this year, XLV remains our Trading Buy.
- Financials recover from recent rate-shock fears, anchored by Berkshire's fortress balance sheet. Financials (XLF) edged up 1.9%, bringing its YTD return to a solid 8.4% and shaking off the severe "AI disruption" and investment banking fears that weighed on the sector in the previous period. The rally was spearheaded by Berkshire Hathaway (BRK.B), which surged 6.6%. In a volatile macro environment with ongoing AI debate and rate hike worries, BRK's massive cash reserves and diversified earnings act as the ultimate defensive shelter. Major banks also found their footing, with Bank of America (BAC) gaining 2.9% and JPMorgan Chase (JPM) adding 1.6%, as the market reassured itself that resilient net interest margins and strong capital positions can offset near-term capital markets softness. BRK/B remains our Core Recommendation.
Worst 3 S&P Sectors (Past 2 Weeks)
Sector ETF | Past 2-Week Return | YTD Return | Stock Drivers Past 2-Weeks |
Information Technology | -2.3% | 18.7% | Dell Technologies Inc. (DELL.N) -12.3%, Corning Incorporated (GLW.N) -7.2%, Salesforce Inc. (CRM.N) -3.7% |
Materials | -2.7% | 16.7% | Corteva, Inc. (CTVA.N) -20.9%, Nucor Corporation (NUE.N) -9.3%, International Flavors & Fragrances Inc. (IFF.N) -14.2% |
Energy | -3.4% | 48.2% | ExxonMobil Holdings Corporation (XOM.N) -5.1%, Chevron Corporation (CVX.N) -3.5%, ConocoPhillips (COP.N) -3.1% |
Source: UOB Kay Hian and iFinD, as of November 13, 2026.
- Information Technology feels the bite of the "AI capex cooldown" and key person risk debate. Info Tech (XLK) retreated 2.3% over the past two weeks, pulling back from its recent highs and moderating its YTD advance to 18.7%. The decline perfectly illustrates the ongoing "sorting mechanism" within the AI trade, where investors ruthlessly differentiate between proven infrastructure winners and laggards facing execution risks. Dell Technologies (DELL) slumped 12.3% amid midterms triggered concerns over datacenter demand and continued pressure on PC demand. Optical networking name Corning (GLW) also retreated 7.2% as investors worry about a datacenter buildout slowdown. Enterprise software bellwether Salesforce (CRM) dipped 3.7% as the market demands clearer proof of SaaS monetization amid agentic AI challenges. Despite the near-term turbulence, the sector's robust YTD performance underscores the secular AI tailwind even as the market shifts from broad momentum to fundamental scrutiny.
- Materials retreats on idiosyncratic shocks and industrial cyclicality. Materials (XLB) declined 2.7%, trimming its YTD gain to 16.7% as the sector faced a toxic mix of stock-specific collapses and broader macro headwinds. Agricultural seed company Corteva (CTVA) plummeted 20.9%, while International Flavors & Fragrances (IFF) tumbled 14.2%, reflecting deepening anxieties over global crop pricing, inventory destocking, and softer consumer demand for specialty ingredients. Meanwhile, steelmaker Nucor (NUE) fell 9.3%, acting as a barometer for the sector's lingering sensitivity to "higher-for-longer" interest rates, which continue to suppress domestic construction and manufacturing activity. The sector remains highly dependent on stabilization in global industrial PMIs and a pivot in Fed policy.
- Energy undergoes profit-taking after a stellar YTD run, but structural hedges remain. Energy (XLE) slipped 3.4% over the past two weeks, marking a normal consolidation phase for the market's top YTD performer, which still boasts a massive 48.2% advance. The broad-based pullback saw integrated majors ExxonMobil (XOM) and Chevron (CVX) retreat 5.1% and 3.5%, respectively, while independent producer ConocoPhillips (COP) dipped 3.1%. This tactical de-risking was driven by near-term softness in crude prices as the blue-sweep in midterms raises hope for a diplomatic solution for the prolonged US-Iran nexus. However, with the sector's cash flow generation remaining exceptionally robust and its role as a premier portfolio hedge against sticky inflation and geopolitical tail risks fully intact, we maintain XLE as our Core Recommendation.
Stocks: Potential Movers and Shakers
Please note that not all stocks mentioned below are recommended by PWM Research / CIO Office. Please refer to the Appendix for our US Stock Model Portfolio and official recommendations. Equity investing involves significant risk. Investor discretion is advised.
Stock | Sector | PWM Research Recommendation | Type of News | Our Read on the News |
Broadcom (AVGO) | Information Technology | Core Recommendation | Channel Checks | Positive |
- Anthropic (ANT) has launched its IPO roadshow, with the indicated price implying a fully diluted valuation of approximately US$1.4tn. Anthropic's compute commitments now total roughly US$900bn through 2045, with Broadcom serving as one of its key TPU suppliers.
- Separately, Google (GOOGL) announced an expansion of its eighth-generation TPU portfolio, introducing TPU 8i Max and TPU 8tx. The new TPU 8i Max appears to roughly double the TPU 8i content (co-developed with Broadcom) within a single package and is expected to begin ramping in 2H27. Recent industry reports suggest that TPU v9 has encountered design-related delays (to 2028). As a result, Google appears to be expanding deployment of Broadcom's TPU 8i as a backup solution while TPU v9 is pushed back or cancelled.
- We believe Broadcom is well-positioned to outperform, supported by several increasingly favorable developments. First, Anthropic has significantly strengthened its funding position, reducing concerns about its ability to finance future compute purchases. Second, fears of TPU market-share loss to MediaTek are beginning to ease as Google expands deals with Broadcom (~40% of Broadcom revenue). Third, leadership uncertainty at Nvidia could create an additional opportunity for Broadcom to gain market shares (Nvidia ~60% vs Broadcom ~20%).
Stock | Sector | PWM Research Recommendation | Type of News | Our Read on the News |
Nvidia (NVDA) | Information Technology | Core Recommendation | Earnings | Negative |
- Nvidia (NVDA) has fallen more than 20%-30% from its peak as the Jensen Huang situation escalated. Although Jensen Huang has resigned, The Financial Times recently reported that he has discussed the possibility of returning.
- We acknowledge the significant key-man risk, as Huang's vision and execution have been central to Nvidia's success. Under Jensen's leadership, Nvidia repeatedly demonstrated the ability to identify major technology inflection points, commit resources decisively, and execute rapidly across its supply chain.
- Over the medium to long term, investors must also consider the risk of organizational change. A new leadership team may alter Nvidia's strategic priorities, and it remains unclear whether the company can continue making the right technology bets that have driven its success over the past decade.
- We will likely need 2-3 quarters to properly assess the capabilities and strategic direction of the new management team. Given the current uncertainty surrounding leadership, we believe the stock is unlikely to revisit its previous highs (~US$240) in the near term.
- Nvidia will report earnings on November 17 (US Time), we expect another strong quarter despite Rubin shipments slower than expectations due to HBM delays. There will be tons of questions post Jensen Huang’s resignation, but key investor focus will be on whether memory price pressure on margin, whether CSPs are slowing down buildout as Democrats won the mid-term election, and how Nvidia will deal with Neocloud financing.
Stock | Sector | PWM Research Recommendation | Type of News | Our Read on the News |
Berkshire Hathaway Class B (BRK/B) | Multiple Industries | Core Recommendation | Earnings | Positive |
- Non-insurance businesses shone. Berkshire Hathaway (BRK) reported 3Q26 operating earnings of US$12.7b, down 5.8% yoy, as weaker insurance results weighed on growth across its other major businesses. Insurance underwriting earnings fell 42.9% to US$1.35b, while insurance investment income declined 14.1% to US$2.7b. BNSF’s earnings increased 19.3% to US$1.7b, Berkshire Hathaway Energy’s rose 8.3% to US$1.6b, and manufacturing, service and retailing earnings grew 11.8% to US$4.0b. Net earnings attributable to shareholders declined 28.2% to US$22.1b, or US$10.33 per Class B share.
- Stepped up capital returns. BRK repurchased US$9.7b of shares during the quarter, compared with US$4.5b in 2Q26, bringing 9M26 buybacks to US$14.4b. Shareholders’ equity reached US$761b as of Sep 26, up 6.1% from end-25. BRK's cash and treasury holdings remain huge at US$373b as of Sep 26, representing an increase of US$4b ytd. Overall, the results showed continued growth across BRK’s non-insurance businesses. Net earnings rose 21.2% yoy to US$57.9b in 9M26.
- Defensive shelter from market volatility. BRK/B trades at a 2026 PE of 26.4x and P/B of 1.66x. BUY BRK due to its diversified earnings and cash-rich balance sheet. (Jonathan Koh)
Stock | Sector | PWM Research Recommendation | Type of News | Our Read on the News |
Tesla (TSLA US) | Consumer Discretionary | No Recommendation | Sales / Products, Corporate Action | Positive |
- Tesla’s China retail sales fell 66.1% yoy to 8,817 units in October, the lowest since July 2022, while exports made up 87% of the 67,829 units its Shanghai plant shipped. On 6 November, Elon Musk said Tesla will wind down Cybertruck production in Texas to make room for the Cybercab, and later extended output to the end of summer 2027. Cox Automotive estimates US Cybertruck sales at 20,237 units in 2025.
- On 12 November, Bloomberg reported that Tesla and SpaceX are negotiating price and control in a merger that could be announced as soon as December. Tesla launched Robotaxi in San Antonio on 9 November, and Finland approved its driver-assistance system.
- We see the SpaceX merger, not car sales, as the stock’s main driver, and its terms decide what Tesla holders own. Tesla is losing market share in China: its retail sales there fell 66.1% yoy in October, nearly five times the 13.7% yoy decline in China’s overall NEV retail sales in the same month. Exports, 87% of Shanghai’s October shipments, will also lose support when China cuts the EV export VAT rebate to 9% from 13% in April 2027. The Cybertruck was about 1% of 2025 deliveries. Key triggers to watch: the 3 December shareholder meeting, a merger announcement and November China sales. (Ken Lee)
Stock | Sector | PWM Research Recommendation | Type of News | Our Read on the News |
SpaceX (SPCX US) | Communication Services | No Recommendation | Channel Checks / Corporate Action | Neutral |
- SpaceX’s Starship Flight 15 successfully reached orbit, spending approximately 22.5 hours from liftoff to its return toward Starbase and completing 14 orbits around Earth. This marks the longest orbital flight for the vehicle to date. Although the spacecraft adjusted its trajectory and ultimately landed in the ocean, the mission provided critical positive proof points for the company's rapid reusability goals. Notably, engine performance showed marked improvement during the launch and initial ascent phase, reinforcing the continued iteration and execution of Starship hardware and software.
- Massive capacity unlocks for Starlink and future compute. The flight successfully deployed 26 operational Starlink V3 satellites, driving significant capacity unlocks. From a mass-to-orbit and satellite generation perspective, each of the last two Starship flights has deployed roughly 10 Falcon 9 launches' worth of capacity. This positions Starship as a key vehicle to scale SpaceX’s connectivity business and, longer-term, supports the company's ambitions to scale orbital compute capacity as it builds out its super intelligence infrastructure.
- Balanced outlook amid technical and corporate overhangs. While Flight 15 provides positive proof points for Starship's reusability and long-term capacity scaling, near-term sentiment is likely to be capped by idiosyncratic headwinds. We are mindful of technical headwinds with large lock-up expiries in December 2026 and June 2027. Furthermore, speculative chatter regarding a potential M&A with Tesla introduces additional valuation complexity and uncertainty for investors, balancing SPCX’s long-term structural advantages against these immediate supply and corporate risks. (Wendy Chen)
Stock | Sector | PWM Research Recommendation | Type of News | Our Read on the News |
McDonald’s (MCD US) | Consumer Discretionary | No Recommendation | Earnings | Positive |
- 3Q26 EPS beat consensus by 6%, while revenue missed by 2%. McDonald’s 3Q26 global comparable sales rose 1.5% yoy. Consolidated revenue reached US$7.16b, up 1% yoy in constant currencies (same for the following yoy), but 2% below consensus. System-wide sales rose 4% yoy. Operating income increased 7% yoy to US$3.6b, with operating margin expanding by 2.8ppt yoy to 50.2%. Net income rose 9% yoy to US$2.5b. Adjusted EPS was US$3.57, up 11% yoy, beating consensus by 6%.
- US comparable sales turned positive in Sep following value interventions. US comparable sales slipped 0.2% yoy in 3Q26, as negative guest counts were largely offset by higher average check. Sales improved through the quarter and turned positive in Sep, after McDonald’s restored digital offers and redirected marketing towards entry-level meal deals and Extra Value Meals. Management is encouraged by baseline traffic through Oct, but clarified that it is not guiding for better 4Q26 US comps. New entry-level bundles are being tested in about 1,900 US restaurants, with a national launch planned for early 2027.
- China remained negative, while Japan led IDL growth. In the International Developmental Licensed Markets segment (IDL), comparable sales rose 4.2% yoy, with all regions positive and Japan delivering its 44th consecutive quarter of growth. China’s comparable sales declined, weighed by a challenging macro backdrop and third-party delivery platforms pulling back on subsidies. In the International Operated Markets segment (IOM), comparable sales rose 1.4% yoy, led by Germany and Australia but offset by France. Management expects 3Q26 conditions to persist through 4Q26.
- 2026 openings target trimmed; mid-single-digit food and paper inflation expected in 2027. McDonald’s now expects about 2,500 gross restaurant openings in 2026, down from 2,600, while maintaining about 2,100 net openings. Capex is guided at about US$3.7b, the low end of the prior US$3.7-3.9b range. Management expects mid-single-digit food and paper inflation in 2027, above historical trends, which will require careful pricing to preserve value leadership.
- Quality name for long-term accumulation, but expect sideways trading after the recent run-up. Post-results, McDonald’s shares have fallen 3%, following an earlier run-up from US$231, while the consensus target price has been revised up 3% to US$299.42. Its 1-year forward PE currently stands at 20.0x, above the S&P 500’s 18.1x, but 15% below its 10-year historical average of 23.5x. While we see McDonald’s as a quality stock for long-term accumulation, we expect it to trade sideways between US$257 and US$290 in the short to mid-term. (Ejann Hiew)
Type of News | Explanation |
Channel Checks | Industry-wide or supply chain news with implications to a particular sector or company |
Corporate Action | Dividends, special dividends, stock splits, share buybacks, equity / bond financing, M&As, spin-offs and restructuring etc. |
Earnings | Quarterly earnings for US-listed companies. Semi-annual earnings for Hong Kong-listed companies |
Insider Dealing | Company insiders’ buying / selling of stocks and derivatives of the company |
Investor Action | Leading investor buying / selling including activist investor actions |
Investor Roadshow | Deal and non-deal roadshows, reverse roadshows (analyst days), and company meetings at investment conferences |
Legal / Regulatory | Lawsuits, legislature/regulation changes, other regulatory events |
Macro / Industry Data | Regular economic or industry data related to the sector or stock |
Sales / Products | Sales or product related news, such as monthly sales or new product launches |
Public Event | Public speeches and appearances by companies in the media or industry conferences |
Appendix A – US Stock Model Portfolio
Analyst
Wendy Chen
wendy.chen@uobkh.comAnalyst
Wang Qi, CFA
qi.wang@uobkh.comAnalyst
In collaboration with UOBKH Institutional Research
Disclosures and disclaimers
This report is provided subject to, and must be read together with, the full Disclosures / Disclaimers available at this link, which are incorporated by reference into this report. In particular, this report is intended for general circulation and informational purposes only and does not constitute personal investment advice or a recommendation to buy or sell any investment product or security. You should independently evaluate the information and, where necessary, seek advice from a qualified financial adviser regarding the suitability of any investment. Analyst certifications required under applicable regulations, including SEC Regulation AC (where relevant), are included in this report. By accessing, receiving or using this report, you acknowledge that you have read, understood and agreed to be bound by the Disclosures / Disclaimers, as may be amended, supplemented or updated from time to time.


