

Periodic/Sector reports
Banking: Funding Quality Takes Centre Stage
MARKET WEIGHT (Maintained)
Analyst
Highlights
Resilient earnings, but with diverging funding profiles. BMRI maintained strong earnings and 19.5% yoy loan growth, but CASA grew only 6.6%, versus BBCA’s better-balanced 8.4% loan and 10.9% CASA growth.
Policy liquidity provides relief, but funding pressure remains. Corporate, investment and SOE lending continue to drive credit growth, while weak organic deposit growth has increased SOE banks’ reliance on time deposits and policy liquidity.
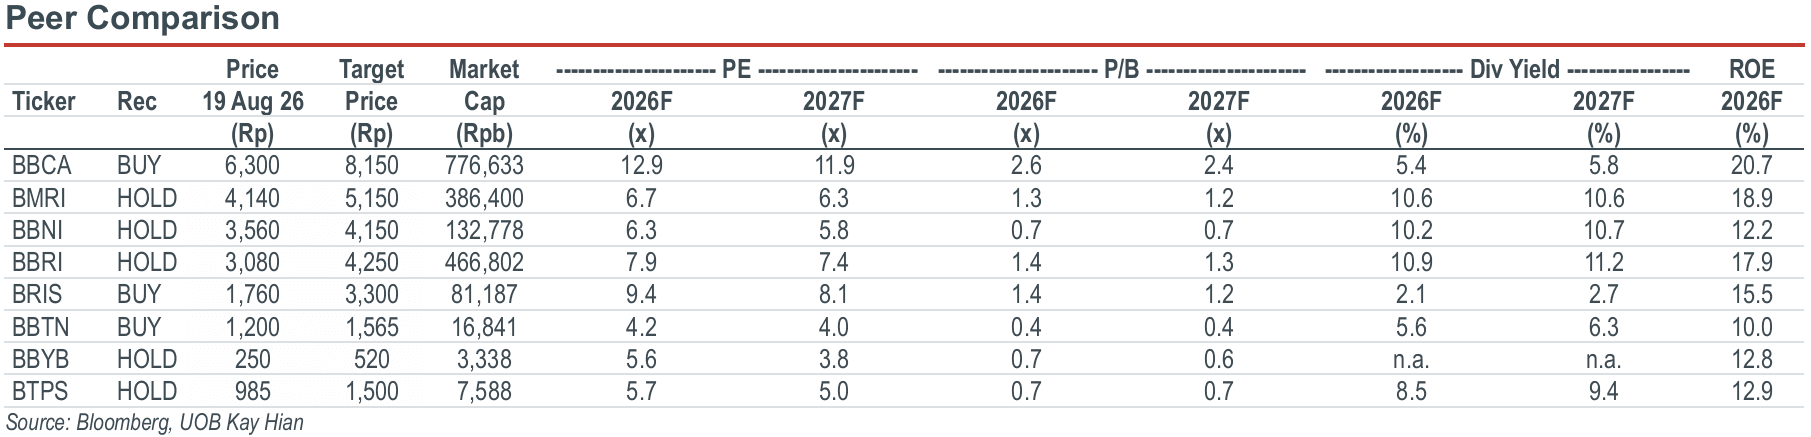
Maintain MARKET WEIGHT; we prefer BBCA. BBCA’s superior CASA and excess liquidity provide better NIM resilience, while successful KopDes repayments and improving funding conditions could support a more constructive view on SOE banks.
Analysis
7M26 results: Earnings remain resilient, but funding profiles are increasingly diverging. Bank Central Asia (BBCA) and Bank Mandiri’s (BMRI) Jul 26 bank-only results reinforce our view that headline earnings remain resilient despite a more challenging liquidity environment. BBCA's 7M26 net profit grew only 1.6% yoy, but momentum improved in July, with net interest income (NII) and net profit rising 3.9% and 5.0% yoy respectively, supported by improving asset yields. BMRI’s headlines growth remained strong, with 7M26 net profit and pre-provision operating profit (PPOP) growing 19.9% and 17.4% yoy consecutively. Nevertheless, the balance sheet trends tell a different story as BMRI's loans grew 19.5% yoy against only 6.6% CASA growth, while BBCA's loans grew 8.4% against 10.9% CASA growth. We believe the widening divergence increasingly reflects the difference between policy-supported balance sheet growth at SOE banks and organically funded growth at BBCA.
Money supply is expanding, but not all liquidity is created equal. Money supply (M2) growth moderated to 8.7% yoy in Jun 26 from 10.8% in May 26, while credit growth remained stronger, with expansion concentrated in corporate (+19.3% yoy) and investment lending (+22.5% yoy), with loans to SOE growing 29.9% yoy. This is consistent with our previous view that underlying credit demand remains uneven, with MSME (+1% yoy) and household (+3.5% yoy) borrowing substantially weaker than corporate credit. More importantly, liquidity available to banks increasingly reflects two different sources, which are: a) organic private sector deposit creation, and b) policy liquidity injected through government placements and Bank Indonesia (BI) incentives. We believe the distinction matters for profitability, as organically generated CASA is structurally cheaper and stickier than government placements or time deposits. This builds on the funding-quality concern highlighted in our previous report, where SOE bank time deposit growth was already materially outpacing CASA growth, leading to a significant drop in CASA ratio.
Government liquidity provides relief, but funding pressures remain. The government's liquidity placement in SOE banks is slightly easing near term liquidity pressure with interbank rates easing to 6.0% from their high of 6.6% this year, albeit remaining above benchmark rates. Repeated liquidity injections also highlight the structural mismatch at SOE banks, where corporate, infrastructure and policy-related lending is expanding faster than organic deposit growth. Combined big-five SOE banks’ loan-to-deposit (LDR) reached around 91.0% in May 26, above the industry's 88.3% (BMRI’s LDR standing at 94.8% in Jul 26). Looking forward, the key question is whether strong corporate and investment lending can eventually translate into broader economic activity and stronger organic deposit growth, which would help narrow the current gap between credit and funding growth.
BBCA's funding advantage is becoming more visible as BMRI faces a higher cost of growth. BMRI's loan growth remained strong at 19.5% yoy, but CASA grew only 6.6%, while time deposits surged 61.1%, pushing its CASA ratio down to 70.4% and LDR up to 94.8%. Funding pressure is beginning to show in the profit and loss, with July interest expense rising 13.1% mom versus 5.2% growth in interest income, leaving NII broadly flat mom. Encouragingly, interest income accelerated to 16.7% yoy in July, suggesting asset repricing is starting to catch up, but the key question for 2H26 is whether asset yields can reprice faster than funding costs. In contrast, BBCA remains significantly better positioned, with CASA growing 10.9% yoy ahead of loan growth of 8.4%, time deposits declining 5.0%, and LDR remaining low at 79.6%. July interest income also accelerated to 5.5% yoy from 1.5% in 7M26, supporting our expectation that higher bond/SRBI yields and loan repricing should drive better earnings in 2H26. We therefore expect BBCA's earnings improvement to be primarily yield-driven, while BMRI's earnings outlook will increasingly depend on its ability to contain funding costs despite strong balance sheet growth.
Highlights
Resilient earnings, but with diverging funding profiles. BMRI maintained strong earnings and 19.5% yoy loan growth, but CASA grew only 6.6%, versus BBCA’s better-balanced 8.4% loan and 10.9% CASA growth.
Policy liquidity provides relief, but funding pressure remains. Corporate, investment and SOE lending continue to drive credit growth, while weak organic deposit growth has increased SOE banks’ reliance on time deposits and policy liquidity.
Maintain MARKET WEIGHT; we prefer BBCA. BBCA’s superior CASA and excess liquidity provide better NIM resilience, while successful KopDes repayments and improving funding conditions could support a more constructive view on SOE banks.
Analysis
7M26 results: Earnings remain resilient, but funding profiles are increasingly diverging. Bank Central Asia (BBCA) and Bank Mandiri’s (BMRI) Jul 26 bank-only results reinforce our view that headline earnings remain resilient despite a more challenging liquidity environment. BBCA's 7M26 net profit grew only 1.6% yoy, but momentum improved in July, with net interest income (NII) and net profit rising 3.9% and 5.0% yoy respectively, supported by improving asset yields. BMRI’s headlines growth remained strong, with 7M26 net profit and pre-provision operating profit (PPOP) growing 19.9% and 17.4% yoy consecutively. Nevertheless, the balance sheet trends tell a different story as BMRI's loans grew 19.5% yoy against only 6.6% CASA growth, while BBCA's loans grew 8.4% against 10.9% CASA growth. We believe the widening divergence increasingly reflects the difference between policy-supported balance sheet growth at SOE banks and organically funded growth at BBCA.
Money supply is expanding, but not all liquidity is created equal. Money supply (M2) growth moderated to 8.7% yoy in Jun 26 from 10.8% in May 26, while credit growth remained stronger, with expansion concentrated in corporate (+19.3% yoy) and investment lending (+22.5% yoy), with loans to SOE growing 29.9% yoy. This is consistent with our previous view that underlying credit demand remains uneven, with MSME (+1% yoy) and household (+3.5% yoy) borrowing substantially weaker than corporate credit. More importantly, liquidity available to banks increasingly reflects two different sources, which are: a) organic private sector deposit creation, and b) policy liquidity injected through government placements and Bank Indonesia (BI) incentives. We believe the distinction matters for profitability, as organically generated CASA is structurally cheaper and stickier than government placements or time deposits. This builds on the funding-quality concern highlighted in our previous report, where SOE bank time deposit growth was already materially outpacing CASA growth, leading to a significant drop in CASA ratio.
Government liquidity provides relief, but funding pressures remain. The government's liquidity placement in SOE banks is slightly easing near term liquidity pressure with interbank rates easing to 6.0% from their high of 6.6% this year, albeit remaining above benchmark rates. Repeated liquidity injections also highlight the structural mismatch at SOE banks, where corporate, infrastructure and policy-related lending is expanding faster than organic deposit growth. Combined big-five SOE banks’ loan-to-deposit (LDR) reached around 91.0% in May 26, above the industry's 88.3% (BMRI’s LDR standing at 94.8% in Jul 26). Looking forward, the key question is whether strong corporate and investment lending can eventually translate into broader economic activity and stronger organic deposit growth, which would help narrow the current gap between credit and funding growth.
BBCA's funding advantage is becoming more visible as BMRI faces a higher cost of growth. BMRI's loan growth remained strong at 19.5% yoy, but CASA grew only 6.6%, while time deposits surged 61.1%, pushing its CASA ratio down to 70.4% and LDR up to 94.8%. Funding pressure is beginning to show in the profit and loss, with July interest expense rising 13.1% mom versus 5.2% growth in interest income, leaving NII broadly flat mom. Encouragingly, interest income accelerated to 16.7% yoy in July, suggesting asset repricing is starting to catch up, but the key question for 2H26 is whether asset yields can reprice faster than funding costs. In contrast, BBCA remains significantly better positioned, with CASA growing 10.9% yoy ahead of loan growth of 8.4%, time deposits declining 5.0%, and LDR remaining low at 79.6%. July interest income also accelerated to 5.5% yoy from 1.5% in 7M26, supporting our expectation that higher bond/SRBI yields and loan repricing should drive better earnings in 2H26. We therefore expect BBCA's earnings improvement to be primarily yield-driven, while BMRI's earnings outlook will increasingly depend on its ability to contain funding costs despite strong balance sheet growth.
MARKET WEIGHT (Maintained)
Analyst
IMPORTANT NOTICE - DISCLOSURES AND DISCLAIMERS
This report is provided subject to, and must be read together with, the full Disclosures / Disclaimers available at this link, which are incorporated by reference into this report. In particular, this report is intended for general circulation and informational purposes only and does not constitute personal investment advice or a recommendation to buy or sell any investment product or security. You should independently evaluate the information and, where necessary, seek advice from a qualified financial adviser regarding the suitability of any investment. Analyst certifications required under applicable regulations, including SEC Regulation AC (where relevant), are included in this report. By accessing, receiving or using this report, you acknowledge that you have read, understood and agreed to be bound by the Disclosures / Disclaimers, as may be amended, supplemented or updated from time to time.


