

Analyst
Wendy Chen
wendy.chen@uobkh.comAnalyst
Wang Qi, CFA
qi.wang@uobkh.comAnalyst
In collaboration with UOBKH Institutional Research
Key US Market Indices
Index | Price | Past 2-Week Return | YTD Return |
S&P 500 | 7,812 | 1.7% | 14.1% |
Dow Jones Industrial Average | 51,655 | 0.3% | 7.5% |
Nasdaq Composite | 27,366 | 2.0% | 17.7% |
Source: UOB Kay Hian and iFinD, as of October 9, 2026.
- The "Fed Wildcard" on full display. Since the September rate hike, macro data has triggered a dramatic repricing of rate path expectations: FedWatch probabilities for an October hike plunged from ~70% to ~20% in just one week, helped by below-expectation employment data and dovish commentary from FOMC members. This volatility encapsulates our "Fed Wildcard" thesis under Chair Warsh's new low-guidance regime. Compounding the uncertainty, geopolitical tensions escalated over the weekend with a renewed Houthi-Saudi conflict, keeping energy prices volatile and inflation risks alive. We’ll keep our eyes on the CPI print on Wed as a key data point ahead of the October 27-28 FOMC.
- Elevated long-term yields send uneven shockwaves. US long-end Treasury yields have remained elevated, due to persistent inflation, rising term premium, and an "AI twist" (see our latest Fixed Income Monthly for details). For equities, rising yields continue to pressure rate-sensitive sectors, while posing risks on banks/FIGs with long-duration asset exposure.
- Headline rally led by tech resurgence. Despite higher cost of equity amid elevated yields, US equities posted resilient gains over the past two weeks, with the growth-oriented Nasdaq Composite (+2.0%) and S&P 500 (+1.7%) outperforming the Dow Jones (+0.3%). This divergence signals continued strong appetite for AI growth against macro crosscurrents, resulting in an extreme market concentration: the 10 largest stocks now constitute 41% of S&P 500’s market cap and 37% of the index’s earnings, according to Goldman Sachs.
- 3Q earnings season: the sorting mechanism at work. We see higher yield continuing to act as a sorting mechanism, as investors increasingly reward perceived AI winners blessed with strong earnings momentum. Consensus expects S&P 500 earnings growth of ~30% in 3Q, the highest entering any reporting season since 2021. We still see upsides to the high expectations from robust growth in AI and energy names. Another tailwind is solid corporate buybacks, which have been a major offsetting force for rising cost of equity: 1H2026 overall buybacks increased +15% yoy, with Nvidia recently announcing the largest buyback in corporate history. Such a vote of confidence reinforces the appeal of US equities.
- Must-read: Our Leading Investor Signals cover Trump’s latest trades on page 3-4.
- Best performing sectors: Utilities (XLU) +5.5%, Energy (XLE) +4.8%, and Consumer Discretionary (XLY) +3.5%.
- Potential movers and shakers:
Positive | Broadcom (AVGO), Micron (MU), Apple (AAPL), Tesla (TSLA) |
Neutral | SpaceX (SPCX) |
Negative | Nike (NKE US) |
- Must Watch Events: US Sep CPI data (Oct 14), October FOMC Rate Decision (Oct 27-28). Earnings: JPM (Oct 13), JNJ (Oct 13), ASML (Oct 14), TSM (Oct 15), KO (Oct 27), GOOGL/META/MSFT/LLY (Oct 29), AAPL/AMZN/MA (Oct 30). Details below.
Date | Macro Data | Sector / Company Events |
Oct 13 |
| Semicon West (till Oct 15). |
Oct 14 | US Sep CPI | Earnings: BAC, ASML NA |
Oct 15 | Initial Jobless Claims, US Sep PPI, US Sep Retail Sales, New Yuan Loans, Outstanding Loan Growth, Total Social Financing | Earnings: TSM |
Oct 16 | Chair Warsh’s Speech in IMF Annual Meeting, US Sep Capacity Utilization |
|
Oct 20 |
| Earnings: NFLX, CATL, China Mobile |
Oct 21 |
| Earnings: IBM, TSLA |
Oct 22 | Initial Jobless Claims | Earnings: NOK, PG, HON |
Oct 23 | S&P Global PMI-Mfg & Svcs Flash. | Oracle AI World Tour (till Oct 28). |
Oct 26 |
| Earnings: VZ, Shenhua, WuXi AppTec |
Oct 27 | US Aug House Price Index | Earnings: KO, PYPL, UPS, HSBC |
Oct 28 | October FOMC Rate Decision (Oct 27-28) | Earnings: BKNG, FDX, V |
Oct 29 | European Central Bank interest rate decisions, Bank of Japan rate decision, US Initial Jobless Claims, US 3Q GDP, US Sep Personal Income/Spending, US Sep PCE. | Earnings: GOOGL, META, MSFT, LLY, SKHY, MRK, NOW, VALE, VW GR, Midea |
Oct 30 |
| Earnings: AAPL, AMZN, ABBV, MA, BYD, ICBC, CCB, ABC, CNOOC, Moutai, Montage Tech |
Oct 31 | US Manufacturing PMI |
|
Leading Investor Signals
One of our key messages is that Trump moves markets, and so do influential leaders such as Nvidia CEO Jensen Huang and Tesla’s Elon Musk. Their words and actions often draw attention to specific investments, shape investor sentiment and drive short-term price swings across markets. It is important to track such signals to understand where investor focus is shifting, how market narratives may evolve, and what potential risks and opportunities lie ahead. We hope you find such insights useful.
President Trump’s Trade Disclosures
Trump’s August 2026 disclosures showed the largest net purchases in Meta Platforms (META; USD 10.0–50.0mn) and Microsoft (MSFT; USD 0.9–5.1mn). Other significant net buys include Netflix (NFLX; USD 1.0–5.0mn), Chevron (CVX; USD 1.0–5.0mn), Walmart (WMT; USD 0.65–4.85mn), Visa (V; USD 0.25–0.50mn), and Mastercard (MA; USD 0.10–0.25mn). The largest net sales were concentrated in the technology and industrial sectors, led by Advanced Micro Devices (AMD; USD 2.0–10.0mn) and Church & Dwight (CHD; USD 2.0–10.0mn).
President Trump’s net reported trading activities for August 2026
Stock / ETF Name | Ticker | GICS Sector | Buy Trades | Aggregate Buy range | Sell Trades | Aggregate Sell range | Net direction | Possible net range |
Meta Platforms Inc | META | Communication Services | 2 | USD 10.0–50.0 mn | 2 | USD 0.002–0.03 mn | Net buy | USD 10.0–50.0 mn |
Microsoft Corp | MSFT | Information Technology | 3 | USD 1.03–5.10 mn | 3 | USD 0.045–0.15 mn | Net buy | USD 0.9–5.1 mn |
Netflix Inc | NFLX | Communication Services | 1-3 | USD 1.0–5.0 mn | 0 | — | Net buy | USD 1.0–5.0 mn |
Chevron Corp | CVX | Energy | 1 | USD 1.0–5.0 mn | 0 | — | Net buy | USD 1.0–5.0 mn |
Walmart Stores Inc | WMT | Consumer Staples | 1 | USD 1.0–5.0 mn | 3 | USD 0.15–0.35 mn | Net buy | USD 0.65–4.85 mn |
Visa Inc | V | Financials | 1 | USD 0.25–0.50 mn | 0 | — | Net buy | USD 0.25–0.50 mn |
Mastercard Inc | MA | Financials | 1 | USD 0.10–0.25 mn | 0 | — | Net buy | USD 0.10–0.25 mn |
Advanced Micro Devices Inc | AMD | Information Technology | 0 | — | 2 | USD 2.0–10.0 mn | Net sell | USD 2.0–10.0 mn |
Church & Dwight Inc | CHD | Consumer Staples | 0 | — | 2 | USD 2.0–10.0 mn | Net sell | USD 2.0–10.0 mn |
Nvidia Corp | NVDA | Information Technology | 3 | USD 0.13–0.35 mn | 3 | USD 1.5–3.0 mn | Net sell | USD 1.15–2.87 mn |
Home Depot Inc | HD | Consumer Discretionary | 0 | — | 2 | USD 1.0–2.0 mn | Net sell | USD 1.0–2.0 mn |
Zoetis Inc | ZTS | Health Care | 0 | — | 1-3 | USD 0.5–3.0 mn | Net sell | USD 0.5–3.0 mn |
T-Mobile US Inc | TMUS | Communication Services | 0 | — | 1-3 | USD 0.5–3.0 mn | Net sell | USD 0.5–3.0 mn |
Datadog Inc | DDOG | Information Technology | 0 | — | 1-3 | USD 0.5–3.0 mn | Net sell | USD 0.5–3.0 mn |
Transdigm Group Inc | TDG | Industrials | 0 | — | 2 | USD 1.0–2.0 mn | Net sell | USD 1.0–2.0 mn |
Dell Technologies Inc | DELL | Information Technology | 0 | — | 1 | USD 0.5–1.0 mn | Net sell | USD 0.5–1.0 mn |
Palo Alto Networks Inc | PANW | Information Technology | 0 | — | 1 | USD 0.5–1.0 mn | Net sell | USD 0.5–1.0 mn |
Boeing Co | BA | Industrials | 0 | — | 1 | USD 0.5–1.0 mn | Net sell | USD 0.5–1.0 mn |
Lennox Intl Inc | LII | Industrials | 0 | — | 1 | USD 0.5–1.0 mn | Net sell | USD 0.5–1.0 mn |
Microchip Technology Inc | MCHP | Information Technology | 0 | — | 1 | USD 0.5–1.0 mn | Net sell | USD 0.5–1.0 mn |
Fortinet Inc | FTNT | Information Technology | 0 | — | 1 | USD 0.5–1.0 mn | Net sell | USD 0.5–1.0 mn |
Broadcom Inc | AVGO | Information Technology | 0 | — | 1 | USD 0.5–1.0 mn | Net sell | USD 0.5–1.0 mn |
Apple Inc | AAPL | Information Technology | 0 | — | 2 | USD 0.002–0.03 mn | Net sell | USD 0.002–0.03 mn |
Amazon.com Inc | AMZN | Consumer Discretionary | 0 | — | 1 | USD 0.015–0.05 mn | Net sell | USD 0.015–0.05 mn |
UnitedHealth Group Inc | UNH | Health Care | 0 | — | 1 | USD 0.10–0.25 mn | Net sell | USD 0.10–0.25 mn |
Palantir Technologies Inc | PLTR | Information Technology | 1 | USD 0.015–0.05 mn | 1 | USD 0.001–0.015 mn | Mixed | Net sell USD 0.014mn to net buy USD 0.049mn |
Modine Manufacturing | MOD | Consumer Discretionary | 0 | — | 3 | USD 0.10–0.25 mn | Net sell | USD 0.10–0.25 mn |
Vanguard Dividend Appreciation ETF | VIG | — | 0 | — | 0 | — | No trades | — |
iShares Russell 1000 ETF | IWB | — | 0 | — | 0 | — | No trades | — |
Source: OGE. Aggregate ranges are calculated by summing the lower and upper bounds of the reported transactions. The possible net range compares minimum purchases with maximum sales and maximum purchases with minimum sales. A net direction is assigned only when the entire resulting range is either positive or negative
Best 3 S&P Sectors (Past 2 Weeks)
Ticker | Sector ETF | Past 2-Week Return | YTD Return | Stock Drivers Past 2-Weeks |
XLU.P | Utilities | 5.5% | -1.0% | Vistra Corp. (VST.N) +17%, The Southern Company (SO.N) +4.6%, Nextera Energy, Inc. (NEE.N) +2.5% |
XLE.P | Energy | 4.8% | 48.4% | Exxonmobil Holdings Corporation (XOM.N) +4%, Marathon Petroleum Corporation (MPC.N) +16.8%, Valero Energy Corporation (VLO.N) +11.3% |
XLY.P | Consumer Discretionary | 3.5% | -4.9% | Royal Caribbean Cruises Ltd. (RCL.N) +16.4%, The Tjx Companies, Inc. (TJX.N) +6.5%, Carnival Corporation Ltd. (CCL.N) +19% |
Source: UOB Kay Hian and iFinD, as of October 9, 2026.
- Utilities staged a sharp relief rally on yield stabilization and AI power demand. Utilities (XLU) gained 5.5% over the last two weeks, significantly narrowing its YTD decline to 1.0% and reversing its status as the worst performer in the last fortnight. The sector's recovery was driven by a tactical relief rally as near-term subsequent rate hike expectations stabilized, restoring the relative appeal of high-dividend "bond proxies". Vistra Corp (VST) surged 17%, vastly outperforming traditional regulated utilities, Southern Company (SO, +4.6%) and NextEra Energy (NEE, +2.5%) also gained. VST’s exceptional strength underscores the market's renewed focus on independent power producers (IPPs) with direct exposure to structural AI-driven data center power demand, which continues to command a robust growth premium despite macro headwinds.
- Energy extends YTD lead on refining margin expansion and geopolitical hedging. Energy (XLE) advanced 4.8%, extending its stellar YTD performance to an outstanding 48.4% and reaffirming its role as a premier portfolio components against macro uncertainty. The past two weeks saw exceptional strength in downstream refining, with Marathon Petroleum (MPC) surging 16.8% and Valero Energy (VLO) jumping 11.3%. This outperformance was driven by elevated diesel prices and highly favorable crack spreads, which disproportionately benefit integrated refiners. Meanwhile, integrated major ExxonMobil (XOM) added a steady 4.0%, supported by elevated crude prices anchored by ongoing geopolitical tensions in the Middle East. With the oil-Iran nexus continuing to limit supply-side downside risks and refining economics improving, XLE remains our Core Recommendation.
- Consumer Discretionary shows resilience in experiential travel and value retail. Consumer Discretionary (XLY) edged up 3.5% over the past two weeks, though it remains in negative territory at -4.9% YTD. The sector's resurgence was highly segmented, driven by a spectacular rally in cruise operators and value-oriented retail. Carnival Corporation (CCL) and Royal Caribbean Cruises (RCL) surged 19% and 16.4%, respectively, signaling that consumer demand for travel and experiential spending remains remarkably resilient despite sticky inflation. Meanwhile, off-price retailer TJX Companies (TJX) advanced 6.5%, highlighting the ongoing consumer shift toward value and trade-down behavior amid elevated energy prices. This divergence reinforced the reality of a K-shaped economy in the US, consumption sentiment muted while specific pockets of experiential (upper K) and value retail (lower K) to deliver growth.
Worst 3 S&P Sectors (Past 2 Weeks)
Ticker | Sector ETF | Past 2-Week Return | YTD Return | Stock Drivers Past 2-Weeks |
XLB.P | Materials | -0.1% | 10.4% | Smurfit Westrock Plc (SW.N) -8.4%, The Sherwin-Williams Company (SHW.N) -4%, The Mosaic Company (MOS.N) -15.8% |
XLV.P | Health Care | -0.3% | 11.7% | Johnson & Johnson (JNJ.N) -3.9%, Bristol-Myers Squibb Company (BMY.N) -6.5%, Merck & Co., Inc. (MRK.N) -2.1% |
XLC.P | Communication Services | -0.7% | -5.4% | AT&T Inc. (T.N) -9.9%, Verizon Communications Inc. (VZ.N) -9.4%, Tko Group Holdings, Inc. (TKO.N) -2% |
Source: UOB Kay Hian and iFinD, as of October 9, 2026.
- Materials edged lower, weighed down by severe idiosyncratic shocks and packaging weakness. Materials (XLB) retreated 0.1% over the past two weeks, moderating its solid YTD advance to 10.4%. The sector's slight decline was driven by notable weakness in key sub-sectors. Fertilizer leader The Mosaic Company (MOS) plummeted 15.8% following RBC downgrading the name on weakening demand. Meanwhile, packaging giant Smurfit Westrock (SW) declined 8.4% and coatings leader Sherwin-Williams (SHW) slipped 4.0%, highlighting lingering concerns over subdued global manufacturing demand and elevated input costs. Despite this near-term stumble, the sector's respectable double-digit YTD gains underscore underlying resilience in domestic pricing power and infrastructure-related demand, warranting selective, bottom-up positioning.
- Health Care undergoes healthy consolidation after robust YTD outperformance. Health Care (XLV) slipped 0.3% over the past two weeks, marking a normal digestion phase for a sector that has served as a reliable defensive anchor, maintaining a robust 11.7% YTD gain. The mild pullback was driven by broad-based profit-taking across mega-cap pharmaceuticals rather than a deterioration in fundamental pipelines. Bristol-Myers Squibb (BMY) led the decline with a 6.5% drop, followed by Johnson & Johnson (JNJ) at -3.9% and Merck (MRK) at -2.1%. Investors appear to be rotating out of year-to-date winners to lock in gains. However, the sector's long-term structural growth drivers, particularly in immunology and oncology, remain firmly intact. JNJ remains our Core Recommendation and XLV our Trading Buy.
- Communication Services dragged down by legacy telecom sell-offs. Communication Services (XLC) edged down 0.7%, pushing the sector deeper into negative territory at -5.4% YTD. The sector's weakness was highly concentrated in the traditional telecommunications space, which faced renewed, sharp selling pressure. AT&T (T) and Verizon (VZ) tumbled 9.9% and 9.4%, respectively, as investors grew increasingly wary of elevated capital expenditure requirements for network upgrades, stubbornly high debt levels, and intense promotional competition with wildcard player like SpaceX. Meanwhile, live sports and entertainment proxy TKO Group (TKO) also retreated 2.0%, reflecting a broader cautious stance on discretionary media spending.
Stocks: Potential Movers and Shakers
Stock | Sector | Type of Events | Our Take | ||
Broadcom (AVGO) | Information Technology | Channel Checks | Positive | ||
- UBS released a channel-check note positive for Broadcom. It is clear now that Broadcom remains deeply engaged with Google beyond TPU v8i, Google will replace MediaTek’s TPU v9 with Broadcom’s v8i and packaging the chips together in a multi-chip module, which will drive the majority of TPU volume in 2028, materially reducing concerns around Broadcom’s medium-term TPU share. And Broadcom's planned transition to 2nm on TPU v10, which is paired with advanced multi-chip packaging, positions the company to capture the dominant share of Google’s TPU volume in 2029.
- Broadcom (AVGO) has agreed to provide Anthropic with $42bn of convertible debt financing to help fund its AI spending. Bank of America, Citigroup, and Morgan Stanley have committed to fund the transaction, including $42bn of senior loans backed by Broadcom, plus another $18bn without a Broadcom guarantee. Besides, Broadcom is reportedly discussing $50bn financing for OpenAI ASIC with Apollo, Blackstone etc.
- The recent weakness in Broadcom shares stemmed primarily from potential TPU market-share loss and circular-financing concerns. UBS’ checks alleviate the first one, while the latter one needs strong Anthropic growth to convince the market. (Garrick Li)
Stock | Sector | Type of Events | Our Take |
Micron (MU) | Information Technology | Earnings | Positive |
- Micron reported record-breaking Aug quarter, with revenue up 31% sequentially and nearly quadrupling (+379.3%) yoy, and EPS of $33.42 beating the $31.61 consensus.
- Management stated explicitly that they see no clear inflection point where industry supply and demand will rebalance, and over 75% of its entire planned shipment capacity for fiscal 2027 is already contractually locked in. This supports our views that memory prices will stay higher for longer.
- Separately, Counterpoint’s checks indicate most Nvidia Rubin are converging on 12 Hi HBM, instead of 8 Hi HBM reported before, countering the bearish views that HBM will be de-spec. We continue to believe that each generation of Nvidia AI system requires higher bandwidth HBM, therefore supporting the growing demand for more advanced HBM. (Garrick Li)
Stock | Sector | Type of Events | Our Take |
Apple (AAPL US) | Information Technology | Channel checks | Positive |
- According to Nikkei, Apple has “told some suppliers to cut production of components for its newly launched iPhone 18 Pro and iPhone 18 Pro Max, as soaring memory chip costs and price increases have dampened consumer demand”.
- This is only partially true. We understand that Apple had indeed trimmed shipment plans for iPhone 18 Pro SKU by 10-15%, however what the article failed to mention or recognise, is that Apple had also raised shipment orders for the iPhone 18 Pro Max SKU by 10-15%, and by 30% for the iPhone DUO. As such, this is nothing more than the common resource allocation according to initial market reception that happens every year. On the contrary, the product mix had shifted towards the premium side which should end up as a net-positive for Apple.
- This checks out with the lead time as well. Our checks show that a) iPhone 18 Pro’s lead time had been underperforming iPhone 17 Pro’s and had been generally sliding in the past two weeks, while b) iPhone 18 Pro Max’s lead time had been either holding up or extending yoy depending on the region. iPhone DUO is not available for orders until 16 Oct but initial consumer interest has been stronger than expected. Therefore, we believe our channel is more reliable compared to Nikkei’s report. (Johnny Yum)
Stock | Sector | Type of Events | Our Take |
Tesla (TSLA US) | Consumer Discretionary | Sales / Products, Corporate Action | Positive |
- Tesla’s 3Q26 deliveries beat expectations as European sales recovered. Deliveries of 486,532 fell 2.1% yoy but 24,558 above the company-compiled consensus of 461,974, and exceeded production by 22,141, a second straight quarter of inventory drawdown. Energy storage deployments rose 9.6% yoy to 13.7GWh.
- On 29 September Tesla signed US$30b of credit lines with Citi and Wells Fargo, replacing a US$5b facility, with 2026 capex guided above US$25b, nearly three times the 2025 level, and free cash flow negative in 2Q26. The Roadster demo slipped two weeks to 15 October, and the EU vote on Full Self-Driving remains set for December.
- The 3Q26 delivery beat came in as a boost to stock. We read the credit lines as spending running ahead of cash generation. Key triggers to watch: 3Q26 results on 21 October, the Roadster demo, and September China retail. (Ken Lee)
Stock | Sector | Type of Events | Our Take |
SpaceX (SPCX US) | Communication Services | Corporate Action | Neutral |
- SpaceX has struck a deal to acquire a nationwide low-band spectrum portfolio, a move that significantly bolsters its satellite-to-cellular ambitions. Low-band spectrum is highly prized for its ability to travel long distances and penetrate buildings, making it ideal for providing ubiquitous mobile coverage. This acquisition reduces SpaceX's reliance on partner spectrum, such as its current direct-to-cell arrangement with T-Mobile, providing the foundational assets to potentially launch a standalone mobile network. It accelerates the timeline for Starlink's direct-to-device services, aiming to eliminate cellular dead zones across the US.
- The move directly challenges legacy US wireless giants, including Verizon, AT&T, and T-Mobile. By controlling its own spectrum and satellite infrastructure, SpaceX can bypass traditional terrestrial tower constraints, potentially disrupting the traditional carrier business model and forcing incumbents to defend their market share.
- While regulatory and integration hurdles remain, SpaceX's vertical integration of launch, satellite, and now spectrum assets create an unparalleled competitive moat. We are mindful of technical headwinds, with large lock-up expiry to follow its 3Q26 result as a near-term overhang. (Wendy Chen)
Stock | Sector | Type of Events | Our Take |
Nike (NKE US) | Consumer Discretionary | Earnings | Negative |
- Nike 1QFY27 results beat on EPS but missed on revenue. Nike announced 1QFY27 results. In 1QFY27, revenue was USD11.2b, down 5% yoy on a currency-neutral basis, and missing consensus by 1%. Gross margin expanded 0.6ppt yoy to 42.8%. Net income was USD712m, down 2% yoy. EPS was USD0.48, beating consensus by 12%. As of end-1QFY27, inventories stood at USD7.8b, down 3% yoy, primarily reflecting shifts in product mix.
- Greater China is expected to remain under pressure into FY28. According to management, Greater China revenue and profitability are expected to remain under pressure through the remainder of FY27 and may partially extend into FY28, as the company continues to clean up the digital marketplace and optimise inventory levels.
- NIKE Sportswear declined at a low-double-digit rate yoy, while NIKE Performance grew by high-single-digit yoy. NIKE Sportswear accounted for just under half of total revenue, with a planned 50% reduction in Dunk revenue creating a USD200m headwind, alongside softer-than-expected sales of certain high-volume sportswear and footwear. These actions have also weighed on future order books as Nike works with wholesale partners to clear excess inventory. Management noted that the lifestyle category currently lacks consumer excitement and market momentum. Meanwhile, NIKE Performance grew by a high-single-digit rate yoy (or low-double-digits excluding the Greater China reset), supported by double-digit growth in running, global football, tennis and golf.
- FY27 revenue guided to decline at a high-single-digit rate yoy. For FY27, management guided revenue to decline by a high-single-digit rate yoy, with EBIT expected to fall at a greater pace than revenue due to gross margin pressure and fixed-cost deleverage, partially offset by disciplined expense management. For 2QFY27, revenue will face a 400bps headwind from lapping EMEA Cyber Week promotions and a tougher comparison base from North America sell-in activities last year.
- New operating model transformation to modernise its global supply chain. Nike announced Pace, an operating model transformation aimed at modernising its global supply chain, with cumulative savings of approximately US$2.5b expected by FY31. The programme is expected to incur around US$1b of implementation costs, in addition to US$300m of FY26 severance expenses. Most savings are anticipated to be realised in FY29-FY30, with the full benefits materialising by FY31.
- Nike’s turnaround is slower than expected, and we remain cautious on the stock for now. Following the 1QFY2027 results, the consensus target price was lowered by 18% to USD 36.51, while the shares are now down only 1%. Nevertheless, the business turnaround is progressing more slowly than expected, and given the difficult consumer environment, we expect the shares to trade range-bound at USD 32-39 over the short to medium term, and we remain cautious. (Ejann Hiew)
Type of Events | Explanation |
Channel Checks | Industry-wide or supply chain news with implications to a particular sector or company |
Corporate Action | Dividends, special dividends, stock splits, share buybacks, equity / bond financing, M&As, spin-offs and restructuring etc. |
Earnings | Quarterly earnings for US-listed companies. Semi-annual earnings for Hong Kong-listed companies |
Insider Dealing | Company insiders’ buying / selling of stocks and derivatives of the company |
Investor Action | Leading investor buying / selling including activist investor actions |
Investor Roadshow | Deal and non-deal roadshows, reverse roadshows (analyst days), and company meetings at investment conferences |
Legal / Regulatory | Lawsuits, legislature/regulation changes, other regulatory events |
Macro / Industry Data | Regular economic or industry data related to the sector or stock |
Sales / Products | Sales or product related news, such as monthly sales or new product launches |
Public Event | Public speeches and appearances by companies in the media or industry conferences |
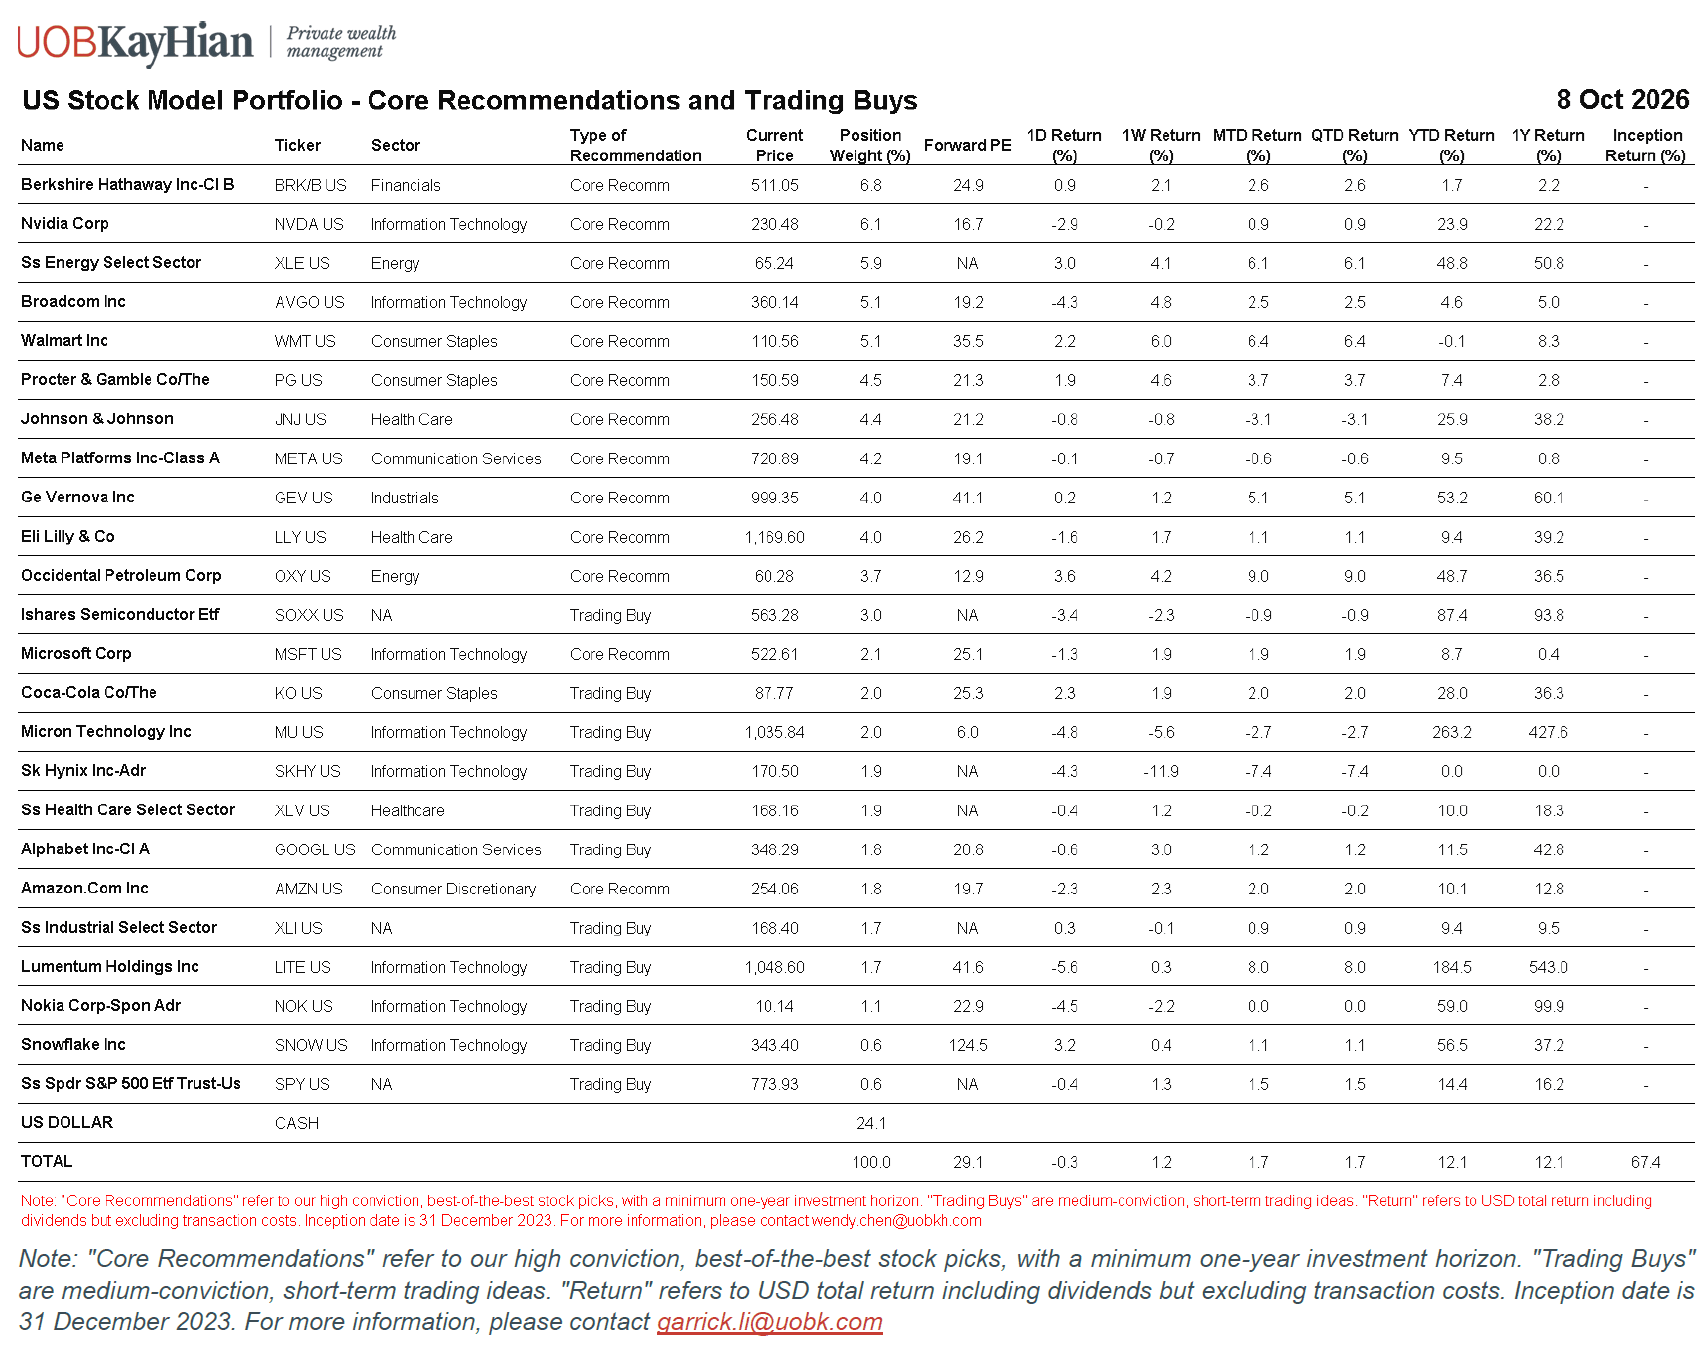
Appendix A – US Stock Model Portfolio
Key US Market Indices
Index | Price | Past 2-Week Return | YTD Return |
S&P 500 | 7,812 | 1.7% | 14.1% |
Dow Jones Industrial Average | 51,655 | 0.3% | 7.5% |
Nasdaq Composite | 27,366 | 2.0% | 17.7% |
Source: UOB Kay Hian and iFinD, as of October 9, 2026.
- The "Fed Wildcard" on full display. Since the September rate hike, macro data has triggered a dramatic repricing of rate path expectations: FedWatch probabilities for an October hike plunged from ~70% to ~20% in just one week, helped by below-expectation employment data and dovish commentary from FOMC members. This volatility encapsulates our "Fed Wildcard" thesis under Chair Warsh's new low-guidance regime. Compounding the uncertainty, geopolitical tensions escalated over the weekend with a renewed Houthi-Saudi conflict, keeping energy prices volatile and inflation risks alive. We’ll keep our eyes on the CPI print on Wed as a key data point ahead of the October 27-28 FOMC.
- Elevated long-term yields send uneven shockwaves. US long-end Treasury yields have remained elevated, due to persistent inflation, rising term premium, and an "AI twist" (see our latest Fixed Income Monthly for details). For equities, rising yields continue to pressure rate-sensitive sectors, while posing risks on banks/FIGs with long-duration asset exposure.
- Headline rally led by tech resurgence. Despite higher cost of equity amid elevated yields, US equities posted resilient gains over the past two weeks, with the growth-oriented Nasdaq Composite (+2.0%) and S&P 500 (+1.7%) outperforming the Dow Jones (+0.3%). This divergence signals continued strong appetite for AI growth against macro crosscurrents, resulting in an extreme market concentration: the 10 largest stocks now constitute 41% of S&P 500’s market cap and 37% of the index’s earnings, according to Goldman Sachs.
- 3Q earnings season: the sorting mechanism at work. We see higher yield continuing to act as a sorting mechanism, as investors increasingly reward perceived AI winners blessed with strong earnings momentum. Consensus expects S&P 500 earnings growth of ~30% in 3Q, the highest entering any reporting season since 2021. We still see upsides to the high expectations from robust growth in AI and energy names. Another tailwind is solid corporate buybacks, which have been a major offsetting force for rising cost of equity: 1H2026 overall buybacks increased +15% yoy, with Nvidia recently announcing the largest buyback in corporate history. Such a vote of confidence reinforces the appeal of US equities.
- Must-read: Our Leading Investor Signals cover Trump’s latest trades on page 3-4.
- Best performing sectors: Utilities (XLU) +5.5%, Energy (XLE) +4.8%, and Consumer Discretionary (XLY) +3.5%.
- Potential movers and shakers:
Positive | Broadcom (AVGO), Micron (MU), Apple (AAPL), Tesla (TSLA) |
Neutral | SpaceX (SPCX) |
Negative | Nike (NKE US) |
- Must Watch Events: US Sep CPI data (Oct 14), October FOMC Rate Decision (Oct 27-28). Earnings: JPM (Oct 13), JNJ (Oct 13), ASML (Oct 14), TSM (Oct 15), KO (Oct 27), GOOGL/META/MSFT/LLY (Oct 29), AAPL/AMZN/MA (Oct 30). Details below.
Date | Macro Data | Sector / Company Events |
Oct 13 |
| Semicon West (till Oct 15). |
Oct 14 | US Sep CPI | Earnings: BAC, ASML NA |
Oct 15 | Initial Jobless Claims, US Sep PPI, US Sep Retail Sales, New Yuan Loans, Outstanding Loan Growth, Total Social Financing | Earnings: TSM |
Oct 16 | Chair Warsh’s Speech in IMF Annual Meeting, US Sep Capacity Utilization |
|
Oct 20 |
| Earnings: NFLX, CATL, China Mobile |
Oct 21 |
| Earnings: IBM, TSLA |
Oct 22 | Initial Jobless Claims | Earnings: NOK, PG, HON |
Oct 23 | S&P Global PMI-Mfg & Svcs Flash. | Oracle AI World Tour (till Oct 28). |
Oct 26 |
| Earnings: VZ, Shenhua, WuXi AppTec |
Oct 27 | US Aug House Price Index | Earnings: KO, PYPL, UPS, HSBC |
Oct 28 | October FOMC Rate Decision (Oct 27-28) | Earnings: BKNG, FDX, V |
Oct 29 | European Central Bank interest rate decisions, Bank of Japan rate decision, US Initial Jobless Claims, US 3Q GDP, US Sep Personal Income/Spending, US Sep PCE. | Earnings: GOOGL, META, MSFT, LLY, SKHY, MRK, NOW, VALE, VW GR, Midea |
Oct 30 |
| Earnings: AAPL, AMZN, ABBV, MA, BYD, ICBC, CCB, ABC, CNOOC, Moutai, Montage Tech |
Oct 31 | US Manufacturing PMI |
|
Leading Investor Signals
One of our key messages is that Trump moves markets, and so do influential leaders such as Nvidia CEO Jensen Huang and Tesla’s Elon Musk. Their words and actions often draw attention to specific investments, shape investor sentiment and drive short-term price swings across markets. It is important to track such signals to understand where investor focus is shifting, how market narratives may evolve, and what potential risks and opportunities lie ahead. We hope you find such insights useful.
President Trump’s Trade Disclosures
Trump’s August 2026 disclosures showed the largest net purchases in Meta Platforms (META; USD 10.0–50.0mn) and Microsoft (MSFT; USD 0.9–5.1mn). Other significant net buys include Netflix (NFLX; USD 1.0–5.0mn), Chevron (CVX; USD 1.0–5.0mn), Walmart (WMT; USD 0.65–4.85mn), Visa (V; USD 0.25–0.50mn), and Mastercard (MA; USD 0.10–0.25mn). The largest net sales were concentrated in the technology and industrial sectors, led by Advanced Micro Devices (AMD; USD 2.0–10.0mn) and Church & Dwight (CHD; USD 2.0–10.0mn).
President Trump’s net reported trading activities for August 2026
Stock / ETF Name | Ticker | GICS Sector | Buy Trades | Aggregate Buy range | Sell Trades | Aggregate Sell range | Net direction | Possible net range |
Meta Platforms Inc | META | Communication Services | 2 | USD 10.0–50.0 mn | 2 | USD 0.002–0.03 mn | Net buy | USD 10.0–50.0 mn |
Microsoft Corp | MSFT | Information Technology | 3 | USD 1.03–5.10 mn | 3 | USD 0.045–0.15 mn | Net buy | USD 0.9–5.1 mn |
Netflix Inc | NFLX | Communication Services | 1-3 | USD 1.0–5.0 mn | 0 | — | Net buy | USD 1.0–5.0 mn |
Chevron Corp | CVX | Energy | 1 | USD 1.0–5.0 mn | 0 | — | Net buy | USD 1.0–5.0 mn |
Walmart Stores Inc | WMT | Consumer Staples | 1 | USD 1.0–5.0 mn | 3 | USD 0.15–0.35 mn | Net buy | USD 0.65–4.85 mn |
Visa Inc | V | Financials | 1 | USD 0.25–0.50 mn | 0 | — | Net buy | USD 0.25–0.50 mn |
Mastercard Inc | MA | Financials | 1 | USD 0.10–0.25 mn | 0 | — | Net buy | USD 0.10–0.25 mn |
Advanced Micro Devices Inc | AMD | Information Technology | 0 | — | 2 | USD 2.0–10.0 mn | Net sell | USD 2.0–10.0 mn |
Church & Dwight Inc | CHD | Consumer Staples | 0 | — | 2 | USD 2.0–10.0 mn | Net sell | USD 2.0–10.0 mn |
Nvidia Corp | NVDA | Information Technology | 3 | USD 0.13–0.35 mn | 3 | USD 1.5–3.0 mn | Net sell | USD 1.15–2.87 mn |
Home Depot Inc | HD | Consumer Discretionary | 0 | — | 2 | USD 1.0–2.0 mn | Net sell | USD 1.0–2.0 mn |
Zoetis Inc | ZTS | Health Care | 0 | — | 1-3 | USD 0.5–3.0 mn | Net sell | USD 0.5–3.0 mn |
T-Mobile US Inc | TMUS | Communication Services | 0 | — | 1-3 | USD 0.5–3.0 mn | Net sell | USD 0.5–3.0 mn |
Datadog Inc | DDOG | Information Technology | 0 | — | 1-3 | USD 0.5–3.0 mn | Net sell | USD 0.5–3.0 mn |
Transdigm Group Inc | TDG | Industrials | 0 | — | 2 | USD 1.0–2.0 mn | Net sell | USD 1.0–2.0 mn |
Dell Technologies Inc | DELL | Information Technology | 0 | — | 1 | USD 0.5–1.0 mn | Net sell | USD 0.5–1.0 mn |
Palo Alto Networks Inc | PANW | Information Technology | 0 | — | 1 | USD 0.5–1.0 mn | Net sell | USD 0.5–1.0 mn |
Boeing Co | BA | Industrials | 0 | — | 1 | USD 0.5–1.0 mn | Net sell | USD 0.5–1.0 mn |
Lennox Intl Inc | LII | Industrials | 0 | — | 1 | USD 0.5–1.0 mn | Net sell | USD 0.5–1.0 mn |
Microchip Technology Inc | MCHP | Information Technology | 0 | — | 1 | USD 0.5–1.0 mn | Net sell | USD 0.5–1.0 mn |
Fortinet Inc | FTNT | Information Technology | 0 | — | 1 | USD 0.5–1.0 mn | Net sell | USD 0.5–1.0 mn |
Broadcom Inc | AVGO | Information Technology | 0 | — | 1 | USD 0.5–1.0 mn | Net sell | USD 0.5–1.0 mn |
Apple Inc | AAPL | Information Technology | 0 | — | 2 | USD 0.002–0.03 mn | Net sell | USD 0.002–0.03 mn |
Amazon.com Inc | AMZN | Consumer Discretionary | 0 | — | 1 | USD 0.015–0.05 mn | Net sell | USD 0.015–0.05 mn |
UnitedHealth Group Inc | UNH | Health Care | 0 | — | 1 | USD 0.10–0.25 mn | Net sell | USD 0.10–0.25 mn |
Palantir Technologies Inc | PLTR | Information Technology | 1 | USD 0.015–0.05 mn | 1 | USD 0.001–0.015 mn | Mixed | Net sell USD 0.014mn to net buy USD 0.049mn |
Modine Manufacturing | MOD | Consumer Discretionary | 0 | — | 3 | USD 0.10–0.25 mn | Net sell | USD 0.10–0.25 mn |
Vanguard Dividend Appreciation ETF | VIG | — | 0 | — | 0 | — | No trades | — |
iShares Russell 1000 ETF | IWB | — | 0 | — | 0 | — | No trades | — |
Source: OGE. Aggregate ranges are calculated by summing the lower and upper bounds of the reported transactions. The possible net range compares minimum purchases with maximum sales and maximum purchases with minimum sales. A net direction is assigned only when the entire resulting range is either positive or negative
Best 3 S&P Sectors (Past 2 Weeks)
Ticker | Sector ETF | Past 2-Week Return | YTD Return | Stock Drivers Past 2-Weeks |
XLU.P | Utilities | 5.5% | -1.0% | Vistra Corp. (VST.N) +17%, The Southern Company (SO.N) +4.6%, Nextera Energy, Inc. (NEE.N) +2.5% |
XLE.P | Energy | 4.8% | 48.4% | Exxonmobil Holdings Corporation (XOM.N) +4%, Marathon Petroleum Corporation (MPC.N) +16.8%, Valero Energy Corporation (VLO.N) +11.3% |
XLY.P | Consumer Discretionary | 3.5% | -4.9% | Royal Caribbean Cruises Ltd. (RCL.N) +16.4%, The Tjx Companies, Inc. (TJX.N) +6.5%, Carnival Corporation Ltd. (CCL.N) +19% |
Source: UOB Kay Hian and iFinD, as of October 9, 2026.
- Utilities staged a sharp relief rally on yield stabilization and AI power demand. Utilities (XLU) gained 5.5% over the last two weeks, significantly narrowing its YTD decline to 1.0% and reversing its status as the worst performer in the last fortnight. The sector's recovery was driven by a tactical relief rally as near-term subsequent rate hike expectations stabilized, restoring the relative appeal of high-dividend "bond proxies". Vistra Corp (VST) surged 17%, vastly outperforming traditional regulated utilities, Southern Company (SO, +4.6%) and NextEra Energy (NEE, +2.5%) also gained. VST’s exceptional strength underscores the market's renewed focus on independent power producers (IPPs) with direct exposure to structural AI-driven data center power demand, which continues to command a robust growth premium despite macro headwinds.
- Energy extends YTD lead on refining margin expansion and geopolitical hedging. Energy (XLE) advanced 4.8%, extending its stellar YTD performance to an outstanding 48.4% and reaffirming its role as a premier portfolio components against macro uncertainty. The past two weeks saw exceptional strength in downstream refining, with Marathon Petroleum (MPC) surging 16.8% and Valero Energy (VLO) jumping 11.3%. This outperformance was driven by elevated diesel prices and highly favorable crack spreads, which disproportionately benefit integrated refiners. Meanwhile, integrated major ExxonMobil (XOM) added a steady 4.0%, supported by elevated crude prices anchored by ongoing geopolitical tensions in the Middle East. With the oil-Iran nexus continuing to limit supply-side downside risks and refining economics improving, XLE remains our Core Recommendation.
- Consumer Discretionary shows resilience in experiential travel and value retail. Consumer Discretionary (XLY) edged up 3.5% over the past two weeks, though it remains in negative territory at -4.9% YTD. The sector's resurgence was highly segmented, driven by a spectacular rally in cruise operators and value-oriented retail. Carnival Corporation (CCL) and Royal Caribbean Cruises (RCL) surged 19% and 16.4%, respectively, signaling that consumer demand for travel and experiential spending remains remarkably resilient despite sticky inflation. Meanwhile, off-price retailer TJX Companies (TJX) advanced 6.5%, highlighting the ongoing consumer shift toward value and trade-down behavior amid elevated energy prices. This divergence reinforced the reality of a K-shaped economy in the US, consumption sentiment muted while specific pockets of experiential (upper K) and value retail (lower K) to deliver growth.
Worst 3 S&P Sectors (Past 2 Weeks)
Ticker | Sector ETF | Past 2-Week Return | YTD Return | Stock Drivers Past 2-Weeks |
XLB.P | Materials | -0.1% | 10.4% | Smurfit Westrock Plc (SW.N) -8.4%, The Sherwin-Williams Company (SHW.N) -4%, The Mosaic Company (MOS.N) -15.8% |
XLV.P | Health Care | -0.3% | 11.7% | Johnson & Johnson (JNJ.N) -3.9%, Bristol-Myers Squibb Company (BMY.N) -6.5%, Merck & Co., Inc. (MRK.N) -2.1% |
XLC.P | Communication Services | -0.7% | -5.4% | AT&T Inc. (T.N) -9.9%, Verizon Communications Inc. (VZ.N) -9.4%, Tko Group Holdings, Inc. (TKO.N) -2% |
Source: UOB Kay Hian and iFinD, as of October 9, 2026.
- Materials edged lower, weighed down by severe idiosyncratic shocks and packaging weakness. Materials (XLB) retreated 0.1% over the past two weeks, moderating its solid YTD advance to 10.4%. The sector's slight decline was driven by notable weakness in key sub-sectors. Fertilizer leader The Mosaic Company (MOS) plummeted 15.8% following RBC downgrading the name on weakening demand. Meanwhile, packaging giant Smurfit Westrock (SW) declined 8.4% and coatings leader Sherwin-Williams (SHW) slipped 4.0%, highlighting lingering concerns over subdued global manufacturing demand and elevated input costs. Despite this near-term stumble, the sector's respectable double-digit YTD gains underscore underlying resilience in domestic pricing power and infrastructure-related demand, warranting selective, bottom-up positioning.
- Health Care undergoes healthy consolidation after robust YTD outperformance. Health Care (XLV) slipped 0.3% over the past two weeks, marking a normal digestion phase for a sector that has served as a reliable defensive anchor, maintaining a robust 11.7% YTD gain. The mild pullback was driven by broad-based profit-taking across mega-cap pharmaceuticals rather than a deterioration in fundamental pipelines. Bristol-Myers Squibb (BMY) led the decline with a 6.5% drop, followed by Johnson & Johnson (JNJ) at -3.9% and Merck (MRK) at -2.1%. Investors appear to be rotating out of year-to-date winners to lock in gains. However, the sector's long-term structural growth drivers, particularly in immunology and oncology, remain firmly intact. JNJ remains our Core Recommendation and XLV our Trading Buy.
- Communication Services dragged down by legacy telecom sell-offs. Communication Services (XLC) edged down 0.7%, pushing the sector deeper into negative territory at -5.4% YTD. The sector's weakness was highly concentrated in the traditional telecommunications space, which faced renewed, sharp selling pressure. AT&T (T) and Verizon (VZ) tumbled 9.9% and 9.4%, respectively, as investors grew increasingly wary of elevated capital expenditure requirements for network upgrades, stubbornly high debt levels, and intense promotional competition with wildcard player like SpaceX. Meanwhile, live sports and entertainment proxy TKO Group (TKO) also retreated 2.0%, reflecting a broader cautious stance on discretionary media spending.
Stocks: Potential Movers and Shakers
Stock | Sector | Type of Events | Our Take | ||
Broadcom (AVGO) | Information Technology | Channel Checks | Positive | ||
- UBS released a channel-check note positive for Broadcom. It is clear now that Broadcom remains deeply engaged with Google beyond TPU v8i, Google will replace MediaTek’s TPU v9 with Broadcom’s v8i and packaging the chips together in a multi-chip module, which will drive the majority of TPU volume in 2028, materially reducing concerns around Broadcom’s medium-term TPU share. And Broadcom's planned transition to 2nm on TPU v10, which is paired with advanced multi-chip packaging, positions the company to capture the dominant share of Google’s TPU volume in 2029.
- Broadcom (AVGO) has agreed to provide Anthropic with $42bn of convertible debt financing to help fund its AI spending. Bank of America, Citigroup, and Morgan Stanley have committed to fund the transaction, including $42bn of senior loans backed by Broadcom, plus another $18bn without a Broadcom guarantee. Besides, Broadcom is reportedly discussing $50bn financing for OpenAI ASIC with Apollo, Blackstone etc.
- The recent weakness in Broadcom shares stemmed primarily from potential TPU market-share loss and circular-financing concerns. UBS’ checks alleviate the first one, while the latter one needs strong Anthropic growth to convince the market. (Garrick Li)
Stock | Sector | Type of Events | Our Take |
Micron (MU) | Information Technology | Earnings | Positive |
- Micron reported record-breaking Aug quarter, with revenue up 31% sequentially and nearly quadrupling (+379.3%) yoy, and EPS of $33.42 beating the $31.61 consensus.
- Management stated explicitly that they see no clear inflection point where industry supply and demand will rebalance, and over 75% of its entire planned shipment capacity for fiscal 2027 is already contractually locked in. This supports our views that memory prices will stay higher for longer.
- Separately, Counterpoint’s checks indicate most Nvidia Rubin are converging on 12 Hi HBM, instead of 8 Hi HBM reported before, countering the bearish views that HBM will be de-spec. We continue to believe that each generation of Nvidia AI system requires higher bandwidth HBM, therefore supporting the growing demand for more advanced HBM. (Garrick Li)
Stock | Sector | Type of Events | Our Take |
Apple (AAPL US) | Information Technology | Channel checks | Positive |
- According to Nikkei, Apple has “told some suppliers to cut production of components for its newly launched iPhone 18 Pro and iPhone 18 Pro Max, as soaring memory chip costs and price increases have dampened consumer demand”.
- This is only partially true. We understand that Apple had indeed trimmed shipment plans for iPhone 18 Pro SKU by 10-15%, however what the article failed to mention or recognise, is that Apple had also raised shipment orders for the iPhone 18 Pro Max SKU by 10-15%, and by 30% for the iPhone DUO. As such, this is nothing more than the common resource allocation according to initial market reception that happens every year. On the contrary, the product mix had shifted towards the premium side which should end up as a net-positive for Apple.
- This checks out with the lead time as well. Our checks show that a) iPhone 18 Pro’s lead time had been underperforming iPhone 17 Pro’s and had been generally sliding in the past two weeks, while b) iPhone 18 Pro Max’s lead time had been either holding up or extending yoy depending on the region. iPhone DUO is not available for orders until 16 Oct but initial consumer interest has been stronger than expected. Therefore, we believe our channel is more reliable compared to Nikkei’s report. (Johnny Yum)
Stock | Sector | Type of Events | Our Take |
Tesla (TSLA US) | Consumer Discretionary | Sales / Products, Corporate Action | Positive |
- Tesla’s 3Q26 deliveries beat expectations as European sales recovered. Deliveries of 486,532 fell 2.1% yoy but 24,558 above the company-compiled consensus of 461,974, and exceeded production by 22,141, a second straight quarter of inventory drawdown. Energy storage deployments rose 9.6% yoy to 13.7GWh.
- On 29 September Tesla signed US$30b of credit lines with Citi and Wells Fargo, replacing a US$5b facility, with 2026 capex guided above US$25b, nearly three times the 2025 level, and free cash flow negative in 2Q26. The Roadster demo slipped two weeks to 15 October, and the EU vote on Full Self-Driving remains set for December.
- The 3Q26 delivery beat came in as a boost to stock. We read the credit lines as spending running ahead of cash generation. Key triggers to watch: 3Q26 results on 21 October, the Roadster demo, and September China retail. (Ken Lee)
Stock | Sector | Type of Events | Our Take |
SpaceX (SPCX US) | Communication Services | Corporate Action | Neutral |
- SpaceX has struck a deal to acquire a nationwide low-band spectrum portfolio, a move that significantly bolsters its satellite-to-cellular ambitions. Low-band spectrum is highly prized for its ability to travel long distances and penetrate buildings, making it ideal for providing ubiquitous mobile coverage. This acquisition reduces SpaceX's reliance on partner spectrum, such as its current direct-to-cell arrangement with T-Mobile, providing the foundational assets to potentially launch a standalone mobile network. It accelerates the timeline for Starlink's direct-to-device services, aiming to eliminate cellular dead zones across the US.
- The move directly challenges legacy US wireless giants, including Verizon, AT&T, and T-Mobile. By controlling its own spectrum and satellite infrastructure, SpaceX can bypass traditional terrestrial tower constraints, potentially disrupting the traditional carrier business model and forcing incumbents to defend their market share.
- While regulatory and integration hurdles remain, SpaceX's vertical integration of launch, satellite, and now spectrum assets create an unparalleled competitive moat. We are mindful of technical headwinds, with large lock-up expiry to follow its 3Q26 result as a near-term overhang. (Wendy Chen)
Stock | Sector | Type of Events | Our Take |
Nike (NKE US) | Consumer Discretionary | Earnings | Negative |
- Nike 1QFY27 results beat on EPS but missed on revenue. Nike announced 1QFY27 results. In 1QFY27, revenue was USD11.2b, down 5% yoy on a currency-neutral basis, and missing consensus by 1%. Gross margin expanded 0.6ppt yoy to 42.8%. Net income was USD712m, down 2% yoy. EPS was USD0.48, beating consensus by 12%. As of end-1QFY27, inventories stood at USD7.8b, down 3% yoy, primarily reflecting shifts in product mix.
- Greater China is expected to remain under pressure into FY28. According to management, Greater China revenue and profitability are expected to remain under pressure through the remainder of FY27 and may partially extend into FY28, as the company continues to clean up the digital marketplace and optimise inventory levels.
- NIKE Sportswear declined at a low-double-digit rate yoy, while NIKE Performance grew by high-single-digit yoy. NIKE Sportswear accounted for just under half of total revenue, with a planned 50% reduction in Dunk revenue creating a USD200m headwind, alongside softer-than-expected sales of certain high-volume sportswear and footwear. These actions have also weighed on future order books as Nike works with wholesale partners to clear excess inventory. Management noted that the lifestyle category currently lacks consumer excitement and market momentum. Meanwhile, NIKE Performance grew by a high-single-digit rate yoy (or low-double-digits excluding the Greater China reset), supported by double-digit growth in running, global football, tennis and golf.
- FY27 revenue guided to decline at a high-single-digit rate yoy. For FY27, management guided revenue to decline by a high-single-digit rate yoy, with EBIT expected to fall at a greater pace than revenue due to gross margin pressure and fixed-cost deleverage, partially offset by disciplined expense management. For 2QFY27, revenue will face a 400bps headwind from lapping EMEA Cyber Week promotions and a tougher comparison base from North America sell-in activities last year.
- New operating model transformation to modernise its global supply chain. Nike announced Pace, an operating model transformation aimed at modernising its global supply chain, with cumulative savings of approximately US$2.5b expected by FY31. The programme is expected to incur around US$1b of implementation costs, in addition to US$300m of FY26 severance expenses. Most savings are anticipated to be realised in FY29-FY30, with the full benefits materialising by FY31.
- Nike’s turnaround is slower than expected, and we remain cautious on the stock for now. Following the 1QFY2027 results, the consensus target price was lowered by 18% to USD 36.51, while the shares are now down only 1%. Nevertheless, the business turnaround is progressing more slowly than expected, and given the difficult consumer environment, we expect the shares to trade range-bound at USD 32-39 over the short to medium term, and we remain cautious. (Ejann Hiew)
Type of Events | Explanation |
Channel Checks | Industry-wide or supply chain news with implications to a particular sector or company |
Corporate Action | Dividends, special dividends, stock splits, share buybacks, equity / bond financing, M&As, spin-offs and restructuring etc. |
Earnings | Quarterly earnings for US-listed companies. Semi-annual earnings for Hong Kong-listed companies |
Insider Dealing | Company insiders’ buying / selling of stocks and derivatives of the company |
Investor Action | Leading investor buying / selling including activist investor actions |
Investor Roadshow | Deal and non-deal roadshows, reverse roadshows (analyst days), and company meetings at investment conferences |
Legal / Regulatory | Lawsuits, legislature/regulation changes, other regulatory events |
Macro / Industry Data | Regular economic or industry data related to the sector or stock |
Sales / Products | Sales or product related news, such as monthly sales or new product launches |
Public Event | Public speeches and appearances by companies in the media or industry conferences |
Appendix A – US Stock Model Portfolio
Analyst
Wendy Chen
wendy.chen@uobkh.comAnalyst
Wang Qi, CFA
qi.wang@uobkh.comAnalyst
In collaboration with UOBKH Institutional Research
Disclosures and disclaimers
This report is provided subject to, and must be read together with, the full Disclosures / Disclaimers available at this link, which are incorporated by reference into this report. In particular, this report is intended for general circulation and informational purposes only and does not constitute personal investment advice or a recommendation to buy or sell any investment product or security. You should independently evaluate the information and, where necessary, seek advice from a qualified financial adviser regarding the suitability of any investment. Analyst certifications required under applicable regulations, including SEC Regulation AC (where relevant), are included in this report. By accessing, receiving or using this report, you acknowledge that you have read, understood and agreed to be bound by the Disclosures / Disclaimers, as may be amended, supplemented or updated from time to time.


